. 2012 Mar 5;51(5):2867-79.
doi: 10.1021/ic202052g. Epub 2012 Feb 14.

Combined spectroscopic/computational studies of vitamin B12 precursors: geometric and electronic structures of cobinamides

Affiliations

Combined spectroscopic/computational studies of vitamin B12 precursors: geometric and electronic structures of cobinamides

Amanda J Reig et al. Inorg Chem. .

Abstract

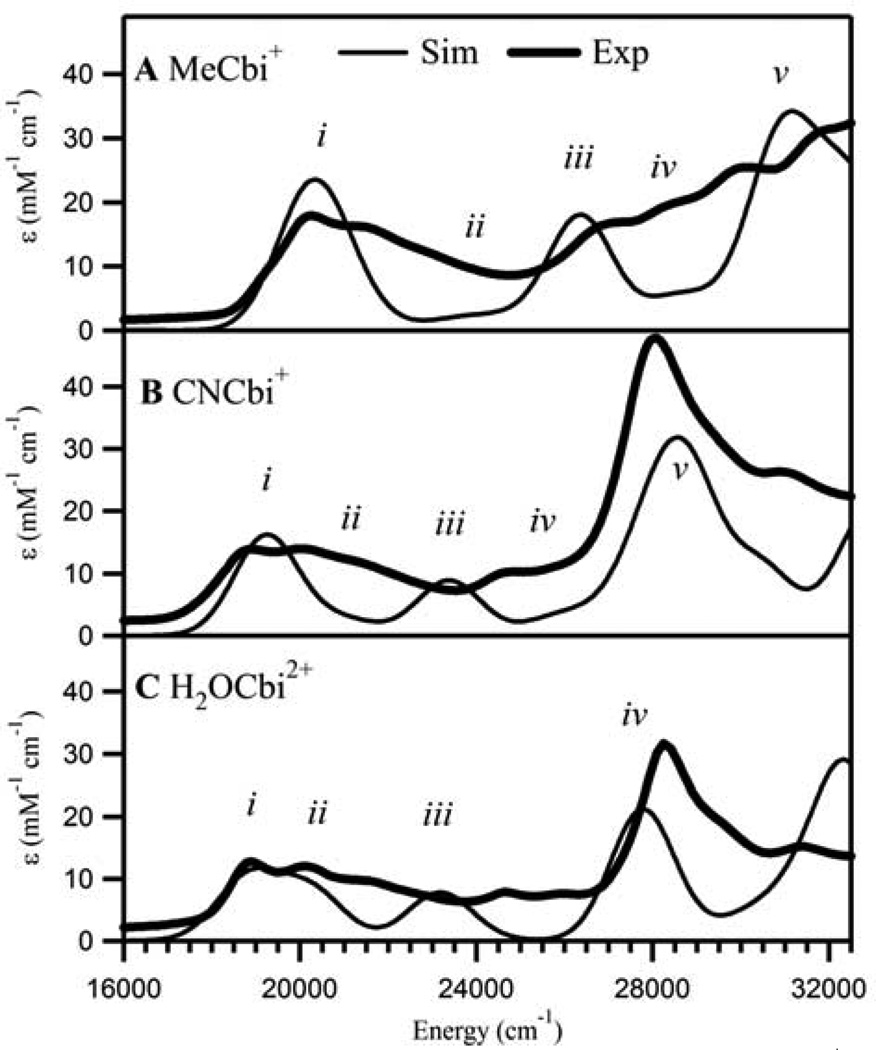
Vitamin B(12) (cyanocobalamin) and its biologically active derivatives, methylcobalamin and adenosylcobalamin, are members of the family of corrinoids, which also includes cobinamides. As biological precursors to cobalamins, cobinamides possess the same structural core, consisting of a low-spin Co(3+) ion that is ligated equatorially by the four nitrogens of a highly substituted tetrapyrrole macrocycle (the corrin ring), but differ with respect to the lower axial ligation. Specifically, cobinamides possess a water molecule instead of the nucleotide loop that coordinates axially to Co(3+)cobalamins via its dimethylbenzimidazole (DMB) base. Compared to the cobalamin species, cobinamides have proven much more difficult to study experimentally, thus far eluding characterization by X-ray crystallography. In this study, we have utilized combined quantum mechanics/molecular mechanics (QM/MM) computations to generate complete structural models of a representative set of cobinamide species with varying upper axial ligands. To validate the use of this approach, analogous QM/MM geometry optimizations were carried out on entire models of the cobalamin counterparts for which high-resolution X-ray structural data are available. The accuracy of the cobinamide structures was assessed further by comparing electronic absorption spectra computed using time-dependent density functional theory to those obtained experimentally. Collectively, the results obtained in this study indicate that the DMB → H(2)O lower axial ligand switch primarily affects the energies of the Co 3d(z(2))-based molecular orbital (MO) and, to a lesser extent, the other Co 3d-based MOs as well as the corrin π-based highest energy MO. Thus, while the energy of the lowest-energy electronic transition of cobalamins changes considerably as a function of the upper axial ligand, it is nearly invariant for the cobinamides.


Figures

Figure 1
Figure 1
Chemical structures of cobalamins (A) and cobinamides (B). A variety of ligands can occupy the upper axial coordination site; e.g., R = CH3, CN, H2O, and adenosyl.
Figure 2
Figure 2
Electronic absorption spectra (at 4.5 K) of AdoCbl and AdoCbi+. A 3000 cm−1 blue-shift of the lowest energy intense feature is observed upon switching the lower axial ligand from the intramolecular DMB base to a solvent-derived H2O molecule.
Figure 3
Figure 3
Schematic depiction of the QM (gray shaded atoms) and MM (unshaded atoms) regions for MeCbl.
Figure 4
Figure 4
Comparison of the X-ray crystallographic (gray) and QM/MM optimized (yellow) structures of MeCbl.
Figure 5
Figure 5
Comparison of the QM/MM optimized structures of MeCbl (gray) and MeCbi+ (yellow).
Figure 6
Figure 6
Experimental (4.5 K) and TD-DFT calculated Abs spectra for MeCbl (A), CNCbl (B), and H2OCbl+ (C). The simulated spectra were red-shifted by 5000 cm−1 to facilitate a direct comparison with the experimental data. The bands in the calculated spectra that have direct counterparts in the experimental spectra are numbered i–v. The α, β, and γ regions are indicated for the experimental H2OCbl+ Abs spectrum. Detailed TD-DFT computed transition descriptions are provided in the Supporting Information, Tables S7–S9.
Figure 7
Figure 7
Experimental (4.5 K) and TD-DFT calculated Abs spectra for MeCbi+ (A), CNCbi+ (B), and H2OCbi2+ (C). The simulated spectra were red-shifted by 5000 cm−1 to facilitate a direct comparison with the experimental data. The bands in the calculated spectra that have direct counterparts in the experimental spectra are numbered i–v. Detailed TD-DFT calculated transition descriptions are provided in the Supporting Information, Tables S10–S12.
Figure 8
Figure 8
Relevant portions of the calculated MO diagrams for MeCbl, CNCbl and H2OCbl+. The individual MO diagrams were shifted vertically to match the energies of the corrin π*-based LUMO (LUMO+1 in the case of H2OCbl+). Note that the HOMO/LUMO gap is not drawn to scale. The MOs are labeled according to their principal contributors, and the relevant electronic transitions contributing to the dominant bands in the TD-DFT calculated Abs spectra (Figure 6) are indicated by arrows (see Tables S7–S9 and Figures S8–S10 for additional information). Circles indicate additional donor orbitals.
Figure 9
Figure 9
Relevant portions of the calculated MO diagrams for MeCbi+, CNCbi+, and H2OCbi2+. The individual MO diagrams were shifted vertically to match the energies of the corrin π*-based LUMO (LUMO+1 in the case of H2OCbi2+). Note that the HOMO/LUMO gap is not drawn to scale. The MOs are labeled according to their principal contributors, and the electronic transitions associated with to the dominant bands in the TD-DFT calculated Abs spectra (Figure 7) are indicated by arrows (see Tables S10–S12 and Figures S8–S10 for additional information). Circles indicate additional donor orbitals.
Figure 10
Figure 10
MO correlation diagram depicting the modulation of the energy of the α-band transition (vertical arrows; not drawn to scale) upon upper and lower axial ligand substitutions. The LUMOs (or LUMO+1 for H2OCbl+ and H2OCbi2+) were set to be of equal energies. The horizontal dashed line connecting the HOMOs of the cobinamides highlights the roughly isoenergetic nature of these orbitals relative to the corresponding LUMOs. Isosurface plots of the donor MOs (i.e. the HOMOs) are shown at the bottom along with the percentage of Co 3dz2 orbital character they contain.

Similar articles

Cited by

References

    1. Comba P, Remenyi R. Coord. Chem. Rev. 2003;238–239:9–20.
    1. Deeth RJ. Comprehensive Coordination Chemistry II. 2004;2:457–465.
    1. Christianson DW, Lipscomb WN. J. Am. Chem. Soc. 1985;107:2682–2686.
    1. Jensen KP, Ryde U. J. Phys. Chem. A. 2003;107:7539–7545.
    1. Noodleman L, Lovell T, Han W-G, Liu T, Torres RA, Himo F. Comprehensive Coordination Chemistry II. 2004;2:491–510.

Publication types