. 2012 Mar 1;11(5):922-33.
doi: 10.4161/cc.11.5.19421. Epub 2012 Mar 1.

Mir-33 regulates cell proliferation and cell cycle progression

Affiliations

Mir-33 regulates cell proliferation and cell cycle progression

Daniel Cirera-Salinas et al. Cell Cycle. .

Abstract

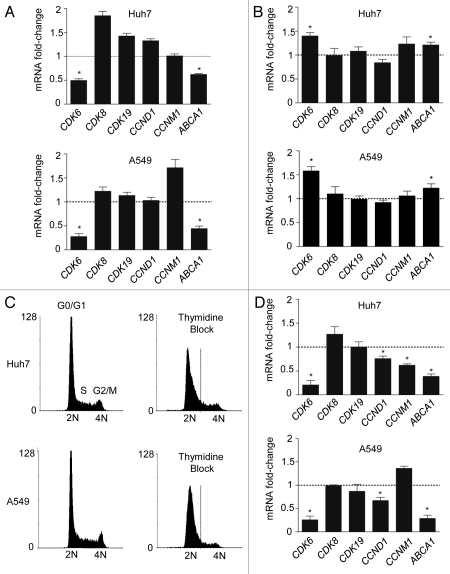
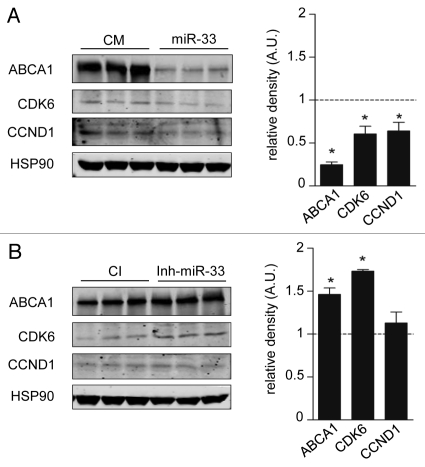
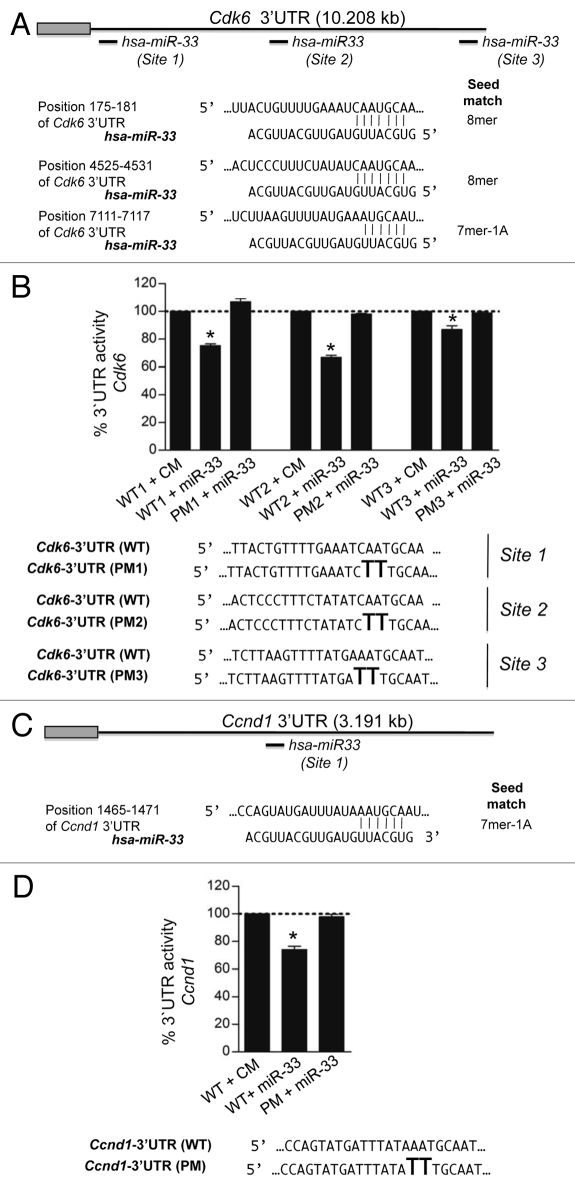
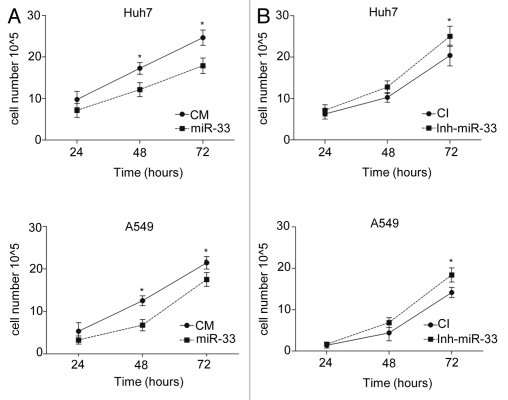
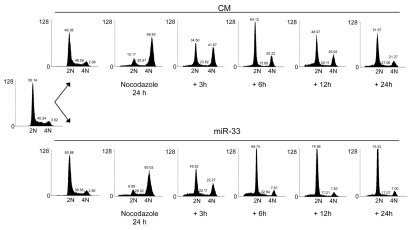
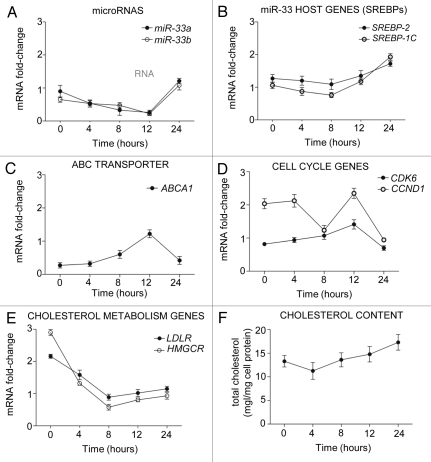
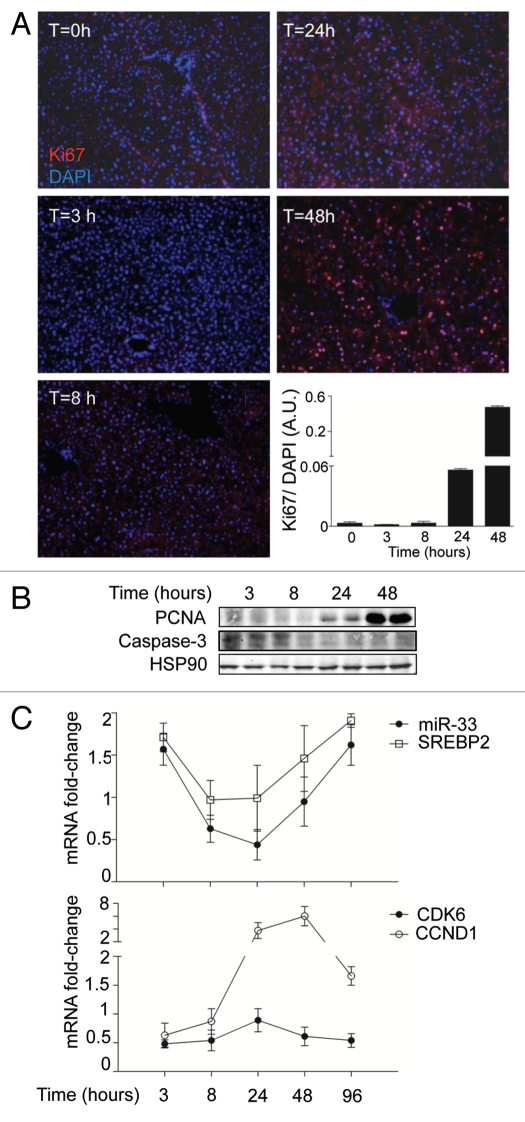
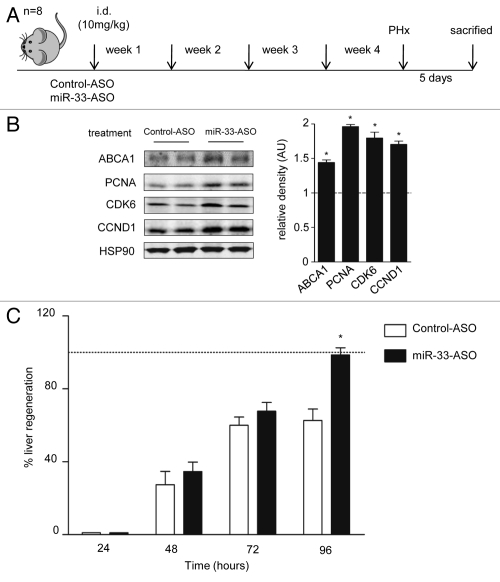
Cholesterol metabolism is tightly regulated at the cellular level and is essential for cellular growth. microRNAs (miRNAs), a class of noncoding RNAs, have emerged as critical regulators of gene expression, acting predominantly at posttranscriptional level. Recent work from our group and others has shown that hsa-miR-33a and hsa-miR-33b, miRNAs located within intronic sequences of the Srebp genes, regulate cholesterol and fatty acid metabolism in concert with their host genes. Here, we show that hsa-miR-33 family members modulate the expression of genes involved in cell cycle regulation and cell proliferation. MiR-33 inhibits the expression of the cyclin-dependent kinase 6 (CDK6) and cyclin D1 (CCND1), thereby reducing cell proliferation and cell cycle progression. Overexpression of miR-33 induces a significant G 1 cell cycle arrest in Huh7 and A549 cell lines. Most importantly, inhibition of miR-33 expression using 2'fluoro/methoxyethyl-modified (2'F/MOE-modified) phosphorothioate backbone antisense oligonucleotides improves liver regeneration after partial hepatectomy (PH) in mice, suggesting an important role for miR-33 in regulating hepatocyte proliferation during liver regeneration. Altogether, these results suggest that Srebp/miR-33 locus may cooperate to regulate cell proliferation, cell cycle progression and may also be relevant to human liver regeneration.


Figures

Figure 1
Figure 1
Post-transcriptional regulation of cell cycle genes and ABCA1 by miR-33. (A) Quantitative RT-PCR expression profile of selected miR-33 predicted target in human hepatic Huh7 cell line (upper part) and human lung A549 cell line (bottom part) after overexpressing miR-33 and (B) after endogenous inhibition of miR-33 by using anti-miR-33 oligonucleotides. (C) Flow cytometry analysis of Huh7 cells (upper parts) and A549 cells (bottom parts) synchronized using double thymidine block (right parts). (D) Quantitative RT-PCR analysis of selected miR-33 predicted targets in Huh7 and A549 cells transfected with CM or miR-33 after thymidine block synchronization. Data are the mean ± SEM and are representative of ≥ 3 experiments. *p ≤ 0.05.
Figure 2
Figure 2
MiR-33 inhibits CDK6 and CCND1 protein expression. Western blot analysis of CDK6, CCND1 and ABCA1 expression from Huh7 cells transfected with CM and miR-33 (A) or CI and anti-miR-33 (B). Data are the mean ± SEM and are representative of more than or equal to three experiments. *p ≤ 0.05.
Figure 3
Figure 3
MiR-33 specifically targets the 3′UTR of Cdk6 and Ccnd1. (A) Sequence alignment of the human hsa-miR-33 mature sequence with the binding sites of the human Cdk6 3′UTR and (B) human Ccnd1 3′UTR. Luciferase reporter activity in COS-7 cells transfected with CM or miR-33 of the (C) Cdk6 and (D) Ccnd1 3′UTR containing the indicated point mutations (PM) in the miR-33 target sites. Data are expressed as mean % of the 3′UTR activity of control miR ± SEM and are representative of ≥ 3 experiments. *p ≤ 0.05.
Figure 4
Figure 4
MiR-33 inhibits cell proliferation. Time-course analysis of the effects of (A) overexpression or (B) inhibition of miR-33 on cell proliferation. Huh7 (upper parts) and A549 (bottom parts) cells were cultured in cholesterol-free medium and transfected with CM, miR-33, CI and Inh-miR-33. At the indicated times, the viable cells were counted. Data correspond to means ± SEM and are representative of ≥ 3 experiments. *p ≤ 0.05.
Figure 5
Figure 5
MiR-33 induces G1 arrest. Cell cycle distribution of A549 cells transfected with CM or miR-33 and synchronized in G2/M with nocodazole. After 24 h of treatment with nocodazole, cells were washed and released from the G2/M cell cycle arrest. At the indicated times, cells were stained with propidium iodide and analyzed by flow cytometry. 2N, cells have diploid DNA content (G0/G1 phase); 4N (G2/M), cells have tetraploid DNA content. Data correspond to a representative experiment among three that gave similar results. FL2-A corresponds to the fluorescence emitted by propidium iodide bound to DNA, which is measured by cytometry in channel 2 (FL2). To avoid the eventual presence of doublets, among the parameters given by the cytometer area (FL2-A) is preferred in order to quantify the amount of DNA present in the cell.
Figure 6
Figure 6
Mir-33 expression levels correlate inversely with its predicted target genes during cell cycle progression. (A–E) Quantitative RT-PCR analysis of miR-33a/b, SREBP-2, SREBP-1, ABCA1, CDK6, CCND1, LDLR and HMGCR in human hepatic Huh7 cells synchronized with nocodazole for 24 h. Data are the mean ± SEM and are representative of three experiment which gave similar results.
Figure 7
Figure 7
Liver regeneration after PH causes a rapid induction of CCND1 expression and miR-33 downregulation. (A) Time-course analysis of Ki67-positive cells from liver sections of mice subjected to PH. The computed assisted quantification of the proliferating cells (red) vs. the total number of cells (blue) is shown at the graph. (B) Western blot analysis of PCNA and cleaved caspase 3 expression from liver lysates of mice subjected to PH. (C) Time-course mRNA expression analysis of miR-33, SREBP-2, CDK6 and CCND1 from liver samples of mice subjected to PH. Data are the mean ± SEM (n = 6 mice).
Figure 8
Figure 8
Inhibition of miR-33 with miR-33-ASO in vivo increased liver regeneration. (A) Experimental outline of miR33-ASO or control-ASO treatment in C57BL/6 mice (n = 8 per group). (B) Representative western blot analysis shows that the inhibition of miR-33 in vivo for 4 weeks increased the expression of PCNA, CDK6, CCND1 and ABCA1. Relative density analysis is shown in the right part. Dotted line positioned at one represents the normalized values of control mice. (C) Effect of miR-33 ASO treatment on liver regeneration after partial hepatectomy. The body weight recovery was used to calculated the percentage of liver regeneration after PHx vs. control animals (dotted line). The data are presented as the mean ± SEM and are representative of eight experiments *p < 0.05.

References

    1. Goldstein JL, Brown MS. Regulation of the mevalonate pathway. Nature. 1990;343:425–430. doi: 10.1038/343425a0. - DOI - PubMed
    1. Brown MS, Goldstein JL. Suppression of 3-hydroxy-3-methylglutaryl coenzyme A reductase activity and inhibition of growth of human fibroblasts by 7-ketocholesterol. J Biol Chem. 1974;249:7306–7314. - PubMed
    1. Chen HW, Heiniger HJ, Kandutsch AA. Relationship between sterol synthesis and DNA synthesis in phytohemagglutinin-stimulated mouse lymphocytes. Proc Natl Acad Sci USA. 1975;72:1950–1954. doi: 10.1073/pnas.72.5.1950. - DOI - PMC - PubMed
    1. Chen HW, Kandutsch AA, Waymouth C. Inhibition of cell growth by oxygenated derivatives of cholesterol. Nature. 1974;251:419–421. doi: 10.1038/251419a0. - DOI - PubMed
    1. Fernández C, Lobo Md Mdel V, Gómez-Coronado D, Lasunción MA. Cholesterol is essential for mitosis progression and its deficiency induces polyploid cell formation. Exp Cell Res. 2004;300:109–120. doi: 10.1016/j.yexcr.2004.06.029. - DOI - PubMed

Publication types