. 2012 Feb 14;30(4):344-8.
doi: 10.1038/nbt.2147.

Automated forward and reverse ratcheting of DNA in a nanopore at 5-Å precision

Affiliations

Automated forward and reverse ratcheting of DNA in a nanopore at 5-Å precision

Gerald M Cherf et al. Nat Biotechnol. .

Abstract

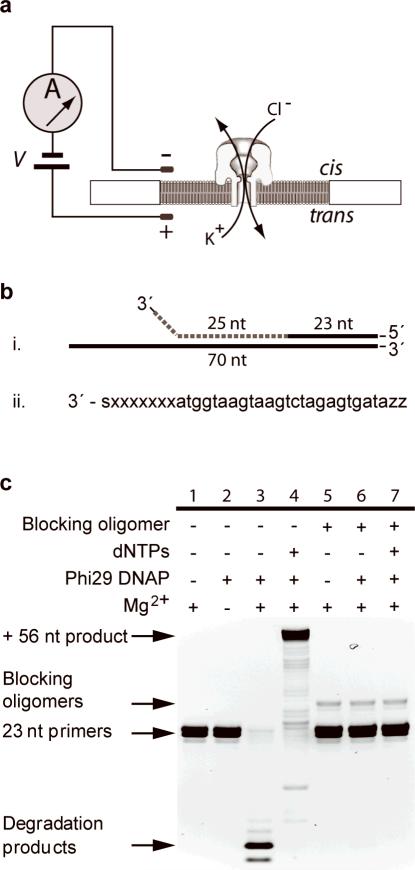
An emerging DNA sequencing technique uses protein or solid-state pores to analyze individual strands as they are driven in single-file order past a nanoscale sensor. However, uncontrolled electrophoresis of DNA through these nanopores is too fast for accurate base reads. Here, we describe forward and reverse ratcheting of DNA templates through the α-hemolysin nanopore controlled by phi29 DNA polymerase without the need for active voltage control. DNA strands were ratcheted through the pore at median rates of 2.5-40 nucleotides per second and were examined at one nucleotide spatial precision in real time. Up to 500 molecules were processed at ∼130 molecules per hour through one pore. The probability of a registry error (an insertion or deletion) at individual positions during one pass along the template strand ranged from 10% to 24.5% without optimization. This strategy facilitates multiple reads of individual strands and is transferable to other nanopore devices for implementation of DNA sequence analysis.


Figures

Figure 1
Figure 1
Experimental set-up. (a) Nanopore device. A single α-HL nanopore is inserted in a lipid bilayer that separates two wells, each containing 100 μl of a buffered KCl solution. DNA bearing a ssDNA segment is added to the cis well. A voltage applied between the wells (trans side +) results in an ionic current that is modulated as individual ssDNA molecules traverse the nanopore. (b) The blocking oligomer strategy. (i) The blocking oligomer (dashed line) protects a DNA substrate composed of a 23 nucleotide primer annealed to a 70mer template strand (Supplementary Fig. 1). (ii) The blocking oligomer is composed of two parts: 1) a 25mer segment complementary to the DNA template near the p/t junction capped at its 5′ end by two acridines (z); and 2) a 3′- tail composed of 7 abasic residues (x) capped by a three-carbon spacer at its terminus (s) (Supplementary Fig. 2). (c) Test of DNA substrate protection in bulk phase using blocking oligomers. DNA substrates were incubated at 23 °C for five hours in nanopore buffer in the presence of phi29 DNAP, dNTPs, and Mg2+ as noted, with or without blocking oligomers. Fluorescently tagged primers were separated by denaturing PAGE (see Online Methods). The arrows mark the full length product (‘+56 nt extension’), the starting primer (‘23nt primers’) and products of exonucleolysis (‘degradation products’).
Figure 2
Figure 2
Forward and reverse ratcheting of DNA through the nanopore. (a) DNA substrate protected by a blocking oligomer. A blocking oligomer (red line) capped by two acridine residues at its 5′ end protects the primer from catalysis in bulk phase. A 94mer DNA template contains five abasic residues (X's at positions 25-to-29) that cause an ionic current increase as they traverse the nanopore. (b, c) Forward and reverse ratcheting of DNA through the nanopore. Roman numerals i-vi of the ionic current trace in panel (b) correspond to cartoons i-vi in panel (c). See text for details. In the cartoon panels, the unzipped strand is shown passing through the enzyme, but this has not been demonstrated unequivocally. (d) Primer terminus chemistry controls replication and traversal of the second current peak. Conditions of this experiment were identical to those in panel (b) except that a 2′,3′-dideoxycytidine monophosphate (ddCMP) was substituted for 2′-deoxycytidine monophosphate (dCMP) at the primer 3′ terminus. The ca. 50 second segment of the current trace at 25 pA (horizontal red arrow) corresponds to position iv in panels (b) and (c). Replication fails to progress and advance the DNA template until phi29 DNAP excises and replaces the ddCMP nucleotide with a dCMP on the primer terminus. At that point, replication proceeds (insert, dashed lines) generating a current peak as in position v of panel (b) and (c). These experiments were performed at 23 °C and 180 mV applied potential in nanopore buffer supplemented with 0.75 μM phi29 DNAP, 1 μM DNA substrate, 100 μM (each) dNTP, 10 mM Mg2+, 1 mM DTT, and 1 mM EDTA.
Figure 3
Figure 3
Reproducible ionic current states as DNA is ratcheted through the nanopore. The DNA template and experimental conditions are identical to those in Figure 2. (a) Representative ionic current trace as a single DNA molecule is ratcheted through the pore. Thirty-three discrete amplitudes are highlighted: -16 to -1 for steps that occur during non-catalytic, voltage-driven unzipping of the blocking oligomer, 0 for the midpoint at 25 pA, and 1 to 16 for steps that occur during DNA replication. The vertical dashed line marks a timescale change required to see steps during DNA replication which is faster than mechanical unzipping. * denotes the -1 position which was absent in most traces; # denotes positions that were misread in this specific trace. (b) Reference map used to identify the current amplitudes shown in (a). Details on how the map was established are described in Supplementary Figure 4. All 25 nucleotide positions along the DNA template were accounted for within the 16 ionic current amplitudes of the replication-dependent peak. This was achieved by compiling ionic current amplitude pauses induced by independently diluting each of the dNTP substrates. The correlation between template positions and ionic current states is noted as n0 to n24 in italics.
Figure 4
Figure 4
Estimating DNA template registry errors in the nanopore during phi29 DNAP controlled translocation. The DNA template and experimental conditions are identical to those described in Figure 2. (a) Example ionic current traces. The traces shown are for the replication-driven ratchet moving DNA templates between ionic current state 7 (26 pA), state 8 (29 pA), and state 9 (34 pA). Movement from state 8 in either direction is equivalent to a one-nucleotide displacement. The data were filtered using a 2kHz low pass Bessel filter. (i) Correct read. The current rises from 27 pA to 29 pA and resides there for at least 3 ms before advancing to 34 pA. (ii) Deletion. The ionic current advances directly from 27 pA to 34 pA and fails to reside at 29 pA for at least 3 ms (arrow). (iii) Insertion. The ionic current trace advances from 27 pA to 29 pA. It resides at 29 pA for at least 3 ms but then slips back to 27 pA for at least 3ms (arrow). These flickers between states may occur more than once before advancing through 29 pA and on to 34 pA, but were scored as a single insertion in this analysis. (b) All ionic current states in the replication-dependent peak were confirmed using a DNA mapping strategy described previously ,. These values are represented by red circles. Numbers n10 to n17 (italics) correspond to nucleotide positions along the template strand as in Figure 3b. Details on how this map was prepared are given in Supplementary Figure 6. (c,d) Model used for error estimates. The black circles are the same ionic current states as those represented in Figure 3b for -12 to -7 (voltage-driven zipper peak) and 7 to 12 (replication-driven ratchet peak). Ionic current state 0 is shown at the center of the map for reference and to emphasize symmetry. States -11, -8, 8 and 11 are the center points of error measurements and are represented by open circles. The green arrows represent correct ionic current progression through those central ionic current states absent ‘indel’ errors. The grey dashed lines are when the current slips back one state before advancing properly. This results in an ‘insertion’. The red dashed lines represent ‘deletions’ when the ionic current trace advances but does not register at the target state. The traces labeled i-iii in (a) correspond to events of types i-iii passing through ionic current state 8 in panel (d). (e) Probability of single nucleotide registry errors for individual molecules ratcheting through the α–HL nanopore controlled by phi29 DNAP. Estimates are based on 200 events for the DNA construct illustrated in Figure 2a. Insertion error frequency (white bars); deletion error frequency (light grey bars); combined error frequency (dark grey bars).

Comment in

  • DNA sequencing with nanopores.
    Schneider GF, Dekker C. Schneider GF, et al. Nat Biotechnol. 2012 Apr 10;30(4):326-8. doi: 10.1038/nbt.2181. Nat Biotechnol. 2012. PMID: 22491281 No abstract available.
  • A nanopore workhorse.
    Rusk N. Rusk N. Nat Methods. 2012 Apr;9(4):322-3. doi: 10.1038/nmeth.1962. Nat Methods. 2012. PMID: 22563599 No abstract available.

References

    1. Eid J, et al. Real-time DNA sequencing from single polymerase molecules. Science. 2009;323:133–138. - PubMed
    1. Harris TD, et al. Single-molecule DNA sequencing of a viral genome. Science. 2008;320:106–109. - PubMed
    1. Kasianowicz JJ, Brandin E, Branton D, Deamer DW. Characterization of individual polynucleotide molecules using a membrane channel. Proc. Natl. Acad. Sci. USA. 1996;93:13770–13773. - PMC - PubMed
    1. Akeson M, Branton D, Kasianowicz JJ, Brandin E, Deamer DW. Microsecond time-scale discrimination among polycytidylic acid, polyadenylic acid, and polyuridylic acid as homopolymers or as segments within single RNA molecules. Biophys. J. 1999;77:3227–3233. - PMC - PubMed
    1. Meller A, Nivon L, Brandin E, Golovchenko J, Branton D. Rapid nanopore discrimination between single polynucleotide molecules. Proc. Natl. Acad. Sci. USA. 2000;97:1079–1084. - PMC - PubMed

Publication types

MeSH terms