. 2012 Feb 14:3:675.
doi: 10.1038/ncomms1678.

CPEB-mediated ZO-1 mRNA localization is required for epithelial tight-junction assembly and cell polarity

Affiliations

CPEB-mediated ZO-1 mRNA localization is required for epithelial tight-junction assembly and cell polarity

Kentaro Nagaoka et al. Nat Commun. .

Abstract

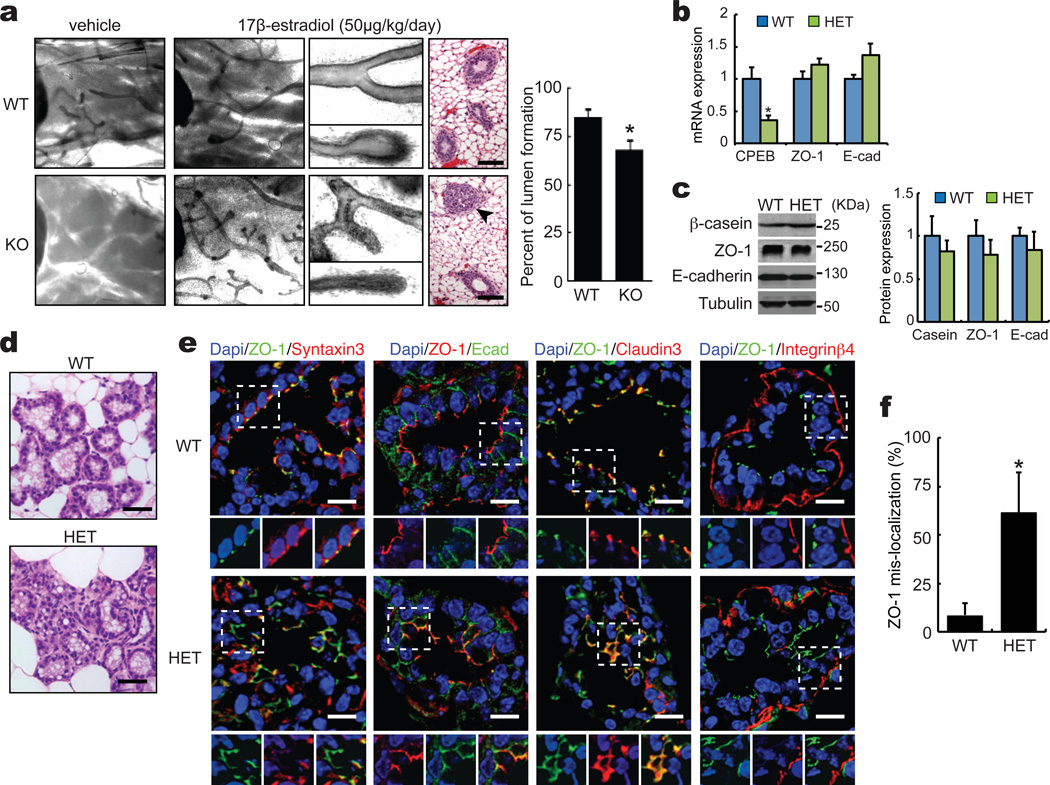
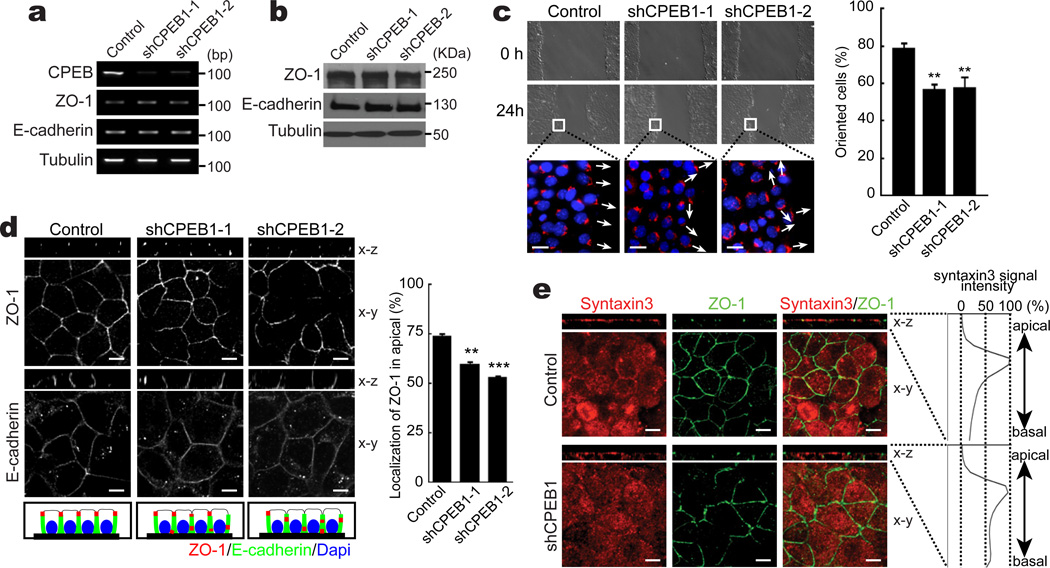
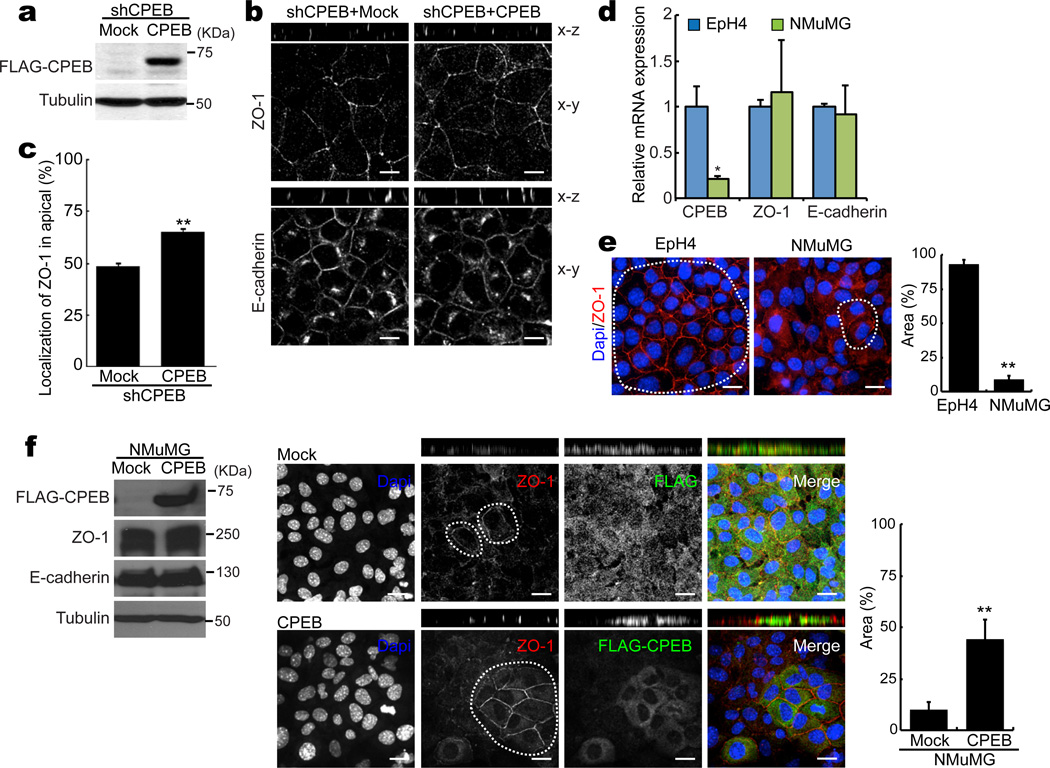
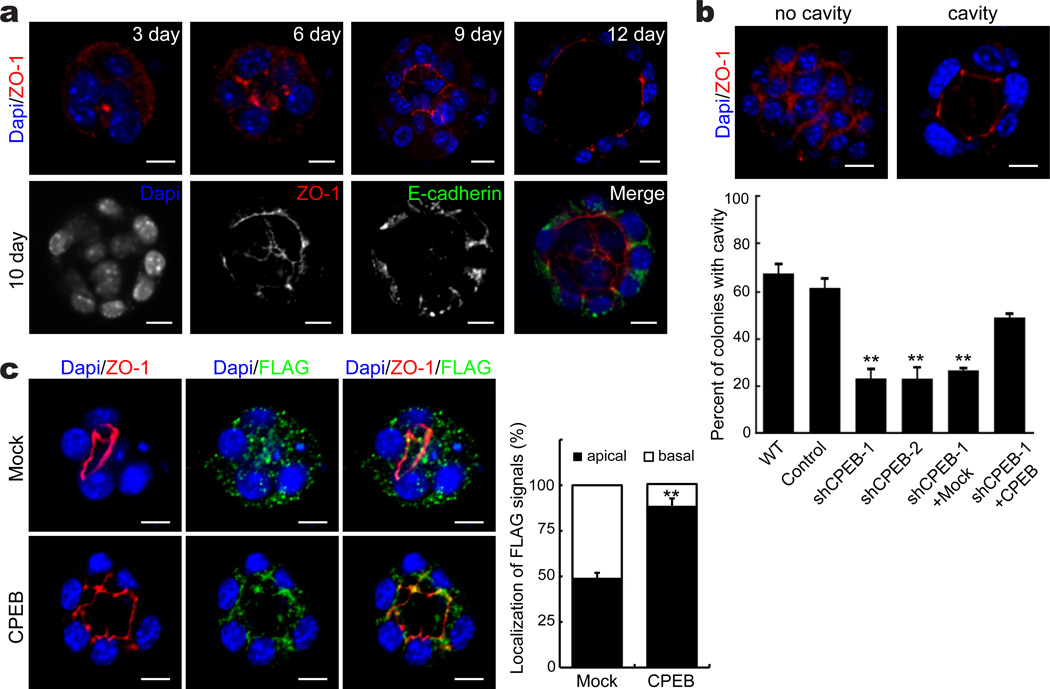
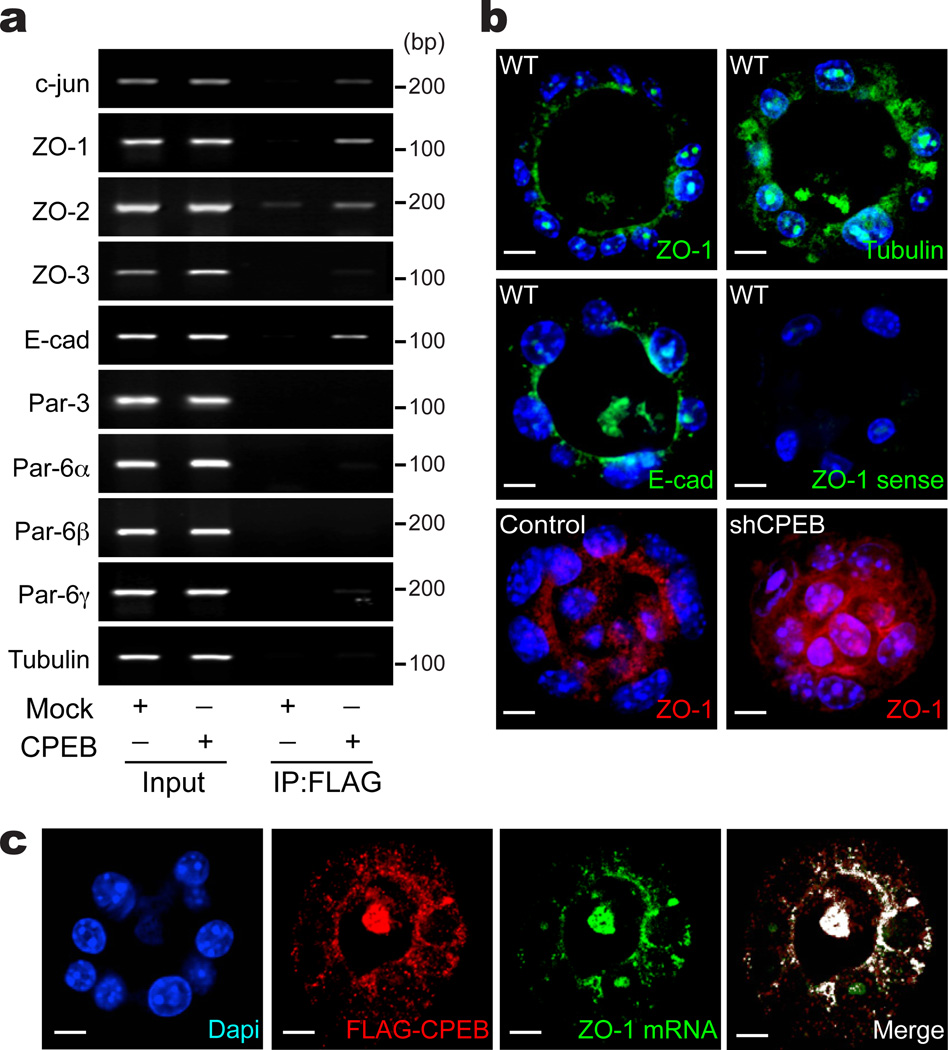
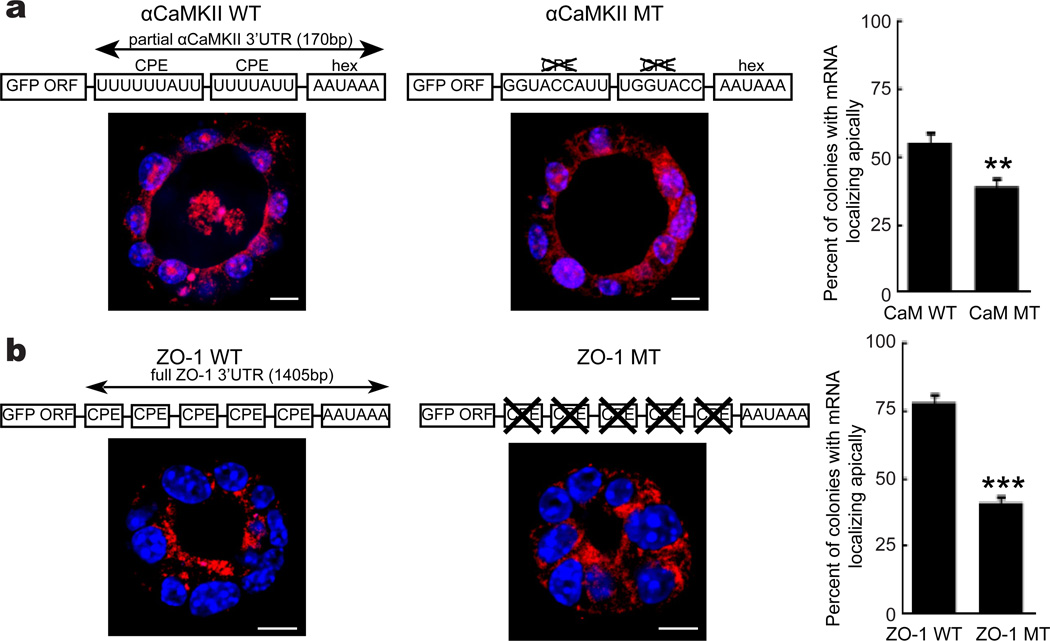
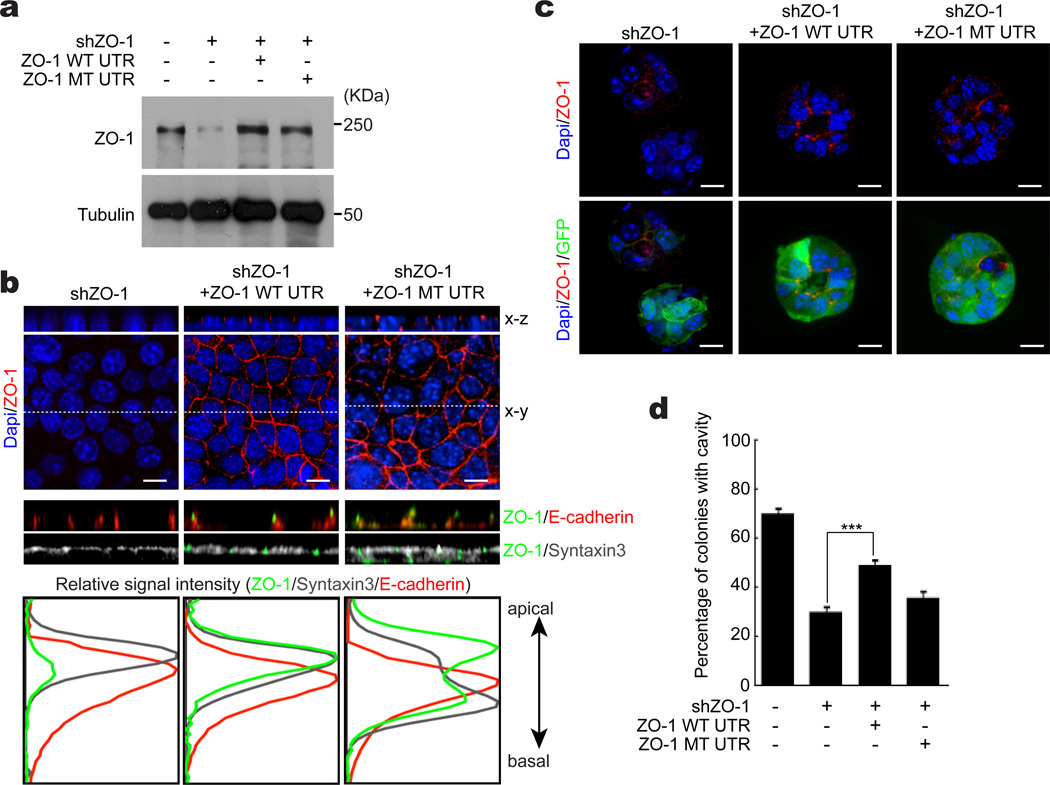
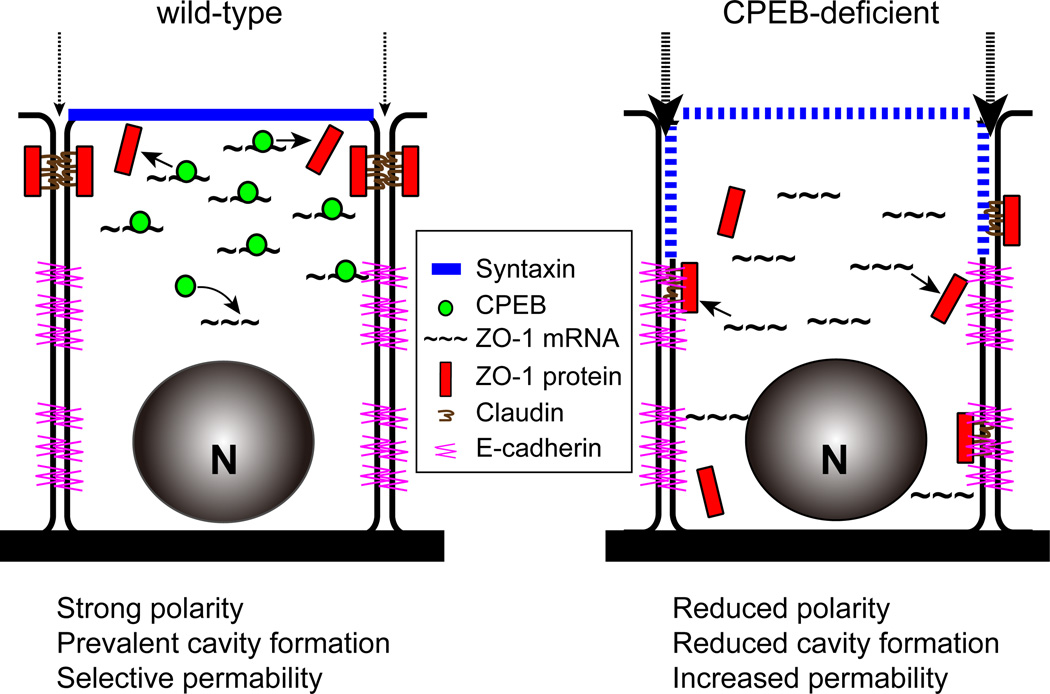
CPEB is a translational regulatory sequence-specific RNA-binding protein that controls germ cell development. Here we show that CPEB heterozygous female mice are fertile but contain disorganized mammary epithelial cells, in which zonal occludens-1 and claudin-3, apical tight-junction proteins, are mislocalized. CPEB depletion from mammary epithelial cells disrupts zonal occludens-1 apical localization and tight-junction distribution; conversely, ectopic expression of CPEB enhances zonal occludens-1 localization. CPEB and zonal occludens-1 mRNA are co-localized apically and zonal occludens-1 3' untranslated region-binding sites for CPEB are necessary for RNA localization. In a three-dimensional culture system that models lumen-containing mammary ducts, depletion of CPEB or zonal occludens-1 impairs central cavity formation, indicating a loss of cell polarity. Cavity formation in zonal occludens-1-depleted cells is rescued when they are transduced with zonal occludens-1 mRNA containing, but not lacking, CPEB-binding sites. Our data demonstrate that CPEB-mediated zonal occludens-1 mRNA localization is essential for tight-junction assembly and mammary epithelial cell polarity.


Figures

Figure 1
Figure 1. Disruption of breast epithelial cell polarity in CPEB knockout and heterozygous mice
(a) WT and CPEB KO mice were injected with vehicle or 17β-estradiol for 5 days followed by isolation of the mammary gland, staining with Carmine’s solution and examination in whole-mount, or fixation, paraffin embedding, and staining with hematoxylin and eosin Y. Scale bar is 50 µm. The asterisk indicates statistical significance (p<0.05, Student’s t test, 3 replicates, error bars are standard error of the mean). (b and c) Quantitative RT-PCR and western blots of RNAs and proteins, respectively, in the mammary gland from WT and CPEB heterozygous (Het) mice. The asterisk indicates statistical significance (p<0.05, Student’s t test, 3 replicates). (d) Sections of mammary gland from WT and CPEB heterozygous mice stained with hematoxylin and eosin Y. Scale bar is 50 µm. (e) Immunostaining of WT and CPEB heterozygous mammary gland for ZO-1, syntaxin-3, claudin-3, E-cadherin, and integrin-β4 (in this and all subsequent immunostaining, DAPI co-staining indicates the nucleus) . The boxes in the large merged images denote areas that are magnified and where the two fluorescent channels are separate as well as merged. Scale bar is 10 µm. (f) The percent of mis-localized ZO-1 mRNA in WT and CPEB KO mammary gland is also indicated. The asterisk indicates statistical significance (p<0.01, Student’s t test, 3 replicates).
Figure 2
Figure 2. CPEB regulates tight junctions and cell polarity of mammary epithelial cells
(a and b) EpH4 cells were infected with lentiviruses expressing GFP only or GFP plus two different shRNAs against CPEB. RT-PCR indicates the level of CPEB RNA depletion and the western blots show the levels of ZO-1, E-cadherin, or tubulin after CPEB depletion. (c) Scratch assay following CPEB knockdown. EpH4 cells infected with control or two different CPEB knockdown viruses were plated and a scratch assay performed to measure cell migration. DIC imagines of cells 0 and 24 hours after the scratch and immunostaining for GM130, a Golgi marker indicating cell polarity, are shown. The arrows indicate Golgi orientation. The histogram shows the quantification of cells that were orented to the scratch. The two asterisks indicate statistical significance from control (p<0.01, Student’s t test, 3 replicates). (d) Confluent EpH4 cells infected with control or CPEB knockdown viruses were immunostained for ZO-1 and E-cadherin. The edge-on perspective of the x-z axis shows the location of ZO-1 in apical, lateral, and basal regions. Scale bar is 10 µm. The diagram illustrates the effect of CPEB depletion on ZO-1 localization and the histogram shows the quantification of ZO-1 in the apical portion of cells in the x-z axis. The asterisks indicate statistical significance (** refers to p<0.01; *** refers to p<0.001, Student’s t test, 3 replicates). (e) Confluent EpH4 cells infected with control or CPEB knockdown viruses were immunostained for ZO-1 and syntaxin-3. The graphs representing flourescence intensity of synatxin-3 in the apical to basal direction. Scale bar is 10 µm. Error bars are standard error of the mean.
Figure 3
Figure 3. CPEB induces ZO-1 localization to the apical surface
(a) CPEB-depleted EpH4 cells were infected with retrovirus-expressing FLAG-tagged CPEB and examined for CPEB expression by western blotting for the FLAG epitope. (b) Immunocytochemistry of ZO-1 and E-cadherin in EpH4 cells in the x-y and x-z orientations following CPEB depletion and in some cases, following ectopic CPEB expression as well. Scale bar is 10 µm. (c) Quantification of apical ZO-1 expression. The two asterisks refer to statistical significance (p<0.01, Student’s t test, 3 replicates) (d) Comparison of CPEB, ZO-1, and E-cadherin expression in EpH4 and NMuMG cells by quantitative RT-PCR. The asterisk refers to statistical significance (p<0.05, Student’s t test, 3 replicates). (e) ZO-1 localization in EpH4 and NMuMG mammary breast epithelial cells. The circles in both cell types indicate regions that are “EpH4-like” with ZO-1 strongly localized to apical regions. The histogram refers to the percentage of the areas that show ZO-1 apical staining. The two asterisks refer to statistical significance (p<0.01, Student’s t test, 3 replicates). Scale bar is 10 µm. (f) Expression levels of FLAG-CPEB, ZO-1, E-cadherin, and tubulin in mock and FLAG-CPEB infected cells. Also shown are NMuMG cells containing ectopically-expressed FLAG-CPEB where ZO-1 protein and FLAG-CPEB were detected by immunostaining. ZO-1 localization was also examined in mock (FLAG only) transduced cells. The circles refer to areas with strong ZO-1 localization to apical regions, and thus resemble EpH4 cells. The percent of the area of the cells that resembles the EpH4-like ZO-1 localization was quantified, which is displayed in the histogram. The two asterisks refer to statistical significance (p<0.01, Student’s t test, 3 replicates). Scale bar is 10 µm. Error bars are standard error of the mean
Figure 4
Figure 4. ZO-1 localization to apical tight junctions and cavity formation require CPEB
(a) EpH4 cells were grown in suspension in matrigel for 3–12 days. Cavity formation was monitored by immunostaining for ZO-1 and E-cadherin and examined by confocal microscopy. Scale bar = 10µm. (b) Analysis of cavity formation in EpH4 cells cultured in matrigel for 12 days. Scale bar is 10 µm. The histogram shows the percent of colonies with cavities following the indicated treatments. The two asterisks refer to statistical significance (p<0.01, Student’s t test, 3 replicates). (c) FLAG-CPEB as well as ZO-1 expression in cells that form cavities. Mock refers to cells expressing FLAG only (a nonsense protein that terminated at a stop codon in vector sequences). Scale bar is 10 µm. The histogram shows quantification of FLAG in the apical portion of cells. The asterisks refers to statistical significance (p<0.01, Student’s t test, 3 replicates). Error bars are standard error of the mean.
Figure 5
Figure 5. CPEB and ZO-1 RNA co-localize at the apical region
(a) RNAs that co-immunoprecipitate with FLAG-CPEB. Input represents 10% of total RNA. Mock refers to FLAG immunoprecipitation from cells that were infected with FLAG only. (b) FISH for ZO-1, tubulin and E-cadherin mRNAs in cavity forming cells. ZO-1 RNA was also probed with a sense strand. FISH for ZO-1 mRNA in control and CPEB knockdown cells is also shown. Scale bar is 10 µm. (c) Double staining for ZO-1 mRNA by FISH and FLAG-CPEB by immunofluorescence. Scale bar is 10 µm.
Figure 6
Figure 6. The CPE is necessary and sufficient for RNA localization to the apical surface
(a) The GFP open reading frame was fused to a portion of the αCaMKII 3’ UTR that contains two CPEs and a polyadenylation hexanucleotide AAUAAA. For comparison, GFP was fused to an identical 3’UTR had the CPEs replaced with an irrelevant sequence. These constructs were transduced into cells followed by culture in matrigel and FISH for GFP. Scale bar is 10 µm. The histogram shows the percent of colonies where the ectopic mRNA was localized apically. The two asterisks refer to statistical significance (p<0.01, Student’s t test, 3 replicates). (b) Cells transduced with the GFP coding region fused to the entire ZO-1 3’ UTR, or the ZO-1 3’ UTR mutating 5 CPEs, were grown on matrigel and processed for GFP FISH. Scale bar is 10 µm. The percent of colonies with GFP RNA localized to the apical surface is shown in the histogram. The three asterisks refer to statistical significance (p<0.001, Student’s t test, 3 replicates). Error bars are standard error of the mean.
Figure 7
Figure 7. CPE control of ZO-1 RNA localization is necessary for cell polarity
(a) EpH4 cells were infected with lentivirus expressing shRNA for ZO-1 were also transduced with retrovirus expressing the entire ZO-1 coding region plus its normal WT 3’ UTR, or an identical 3’ UTR where 5 CPEs were mutated. The Western blot shows the levels of ZO-1, with tubulin serving as a loading control. (b) Cells expressing the constructs noted in panel a were grown on a monolayer and then immunostained for ZO-1, E-cadherin, and syntaxin-3. Confocal images are shown along the x-y and x-z axes, where the relative fluorescence intensities of the proteins were quantified. Scale bar is 10 µm. (c) Cells expressing the same constructs as in panel b were grown in an anchorage-independent manner. The cells were immunostainnd for ZO-1 and GFP. In the confocal images of the colonies, green indicates cells infected with shZO-1 and GFP expressing virus, red indicates immunostaining for ZO-1, and blue indicates DAPI. Scale bar is 10 µm. (d) The histogram shows the percent of colonies with cavities following the indicated treatments. The three asterisks refer to statistical significance (p<0.001, Student’s t test, 3 replicates). Error bars are standard error of the mean.
Figure 8
Figure 8. Model depicting CPEB control of apical ZO-1 mRNA localization
The thin and thick dashed arrows refer to strong and weak tight junction barriers to the passage of solutes in wild type and CPEB-deficient cells, repectively.

Comment in

Similar articles

Cited by

References

    1. Holt CE, Bullock SL. Subcellular mRNA localization in animal cells and why it matters. Science. 2009;326:1212–1216. - PMC - PubMed
    1. St Johnston D, Ahringer J. Cell polarity in eggs and epithelia: parallels and diversity. Cell. 2010;141:757–774. - PubMed
    1. Meignin C, Davis I. Transmitting the message: intracellular mRNA localization. Curr Opin Cell Biol. 2010;22:112–119. - PubMed
    1. Becalska AN, Gavis ER. Lighting up mRNA localization in Drosophila oogenesis. Development. 2009;136:2493–2503. - PMC - PubMed
    1. Czaplinski K, Singer RH. Pathways for mRNA localization in the cytoplasm. Trends Biochem Sci. 2006;31:687–693. - PubMed

Publication types

MeSH terms