

A method to determine the necessity for global signal regression in resting-state fMRI studies
- PMID: 22334332
- PMCID: PMC3382008
- DOI: 10.1002/mrm.24201
A method to determine the necessity for global signal regression in resting-state fMRI studies
Abstract
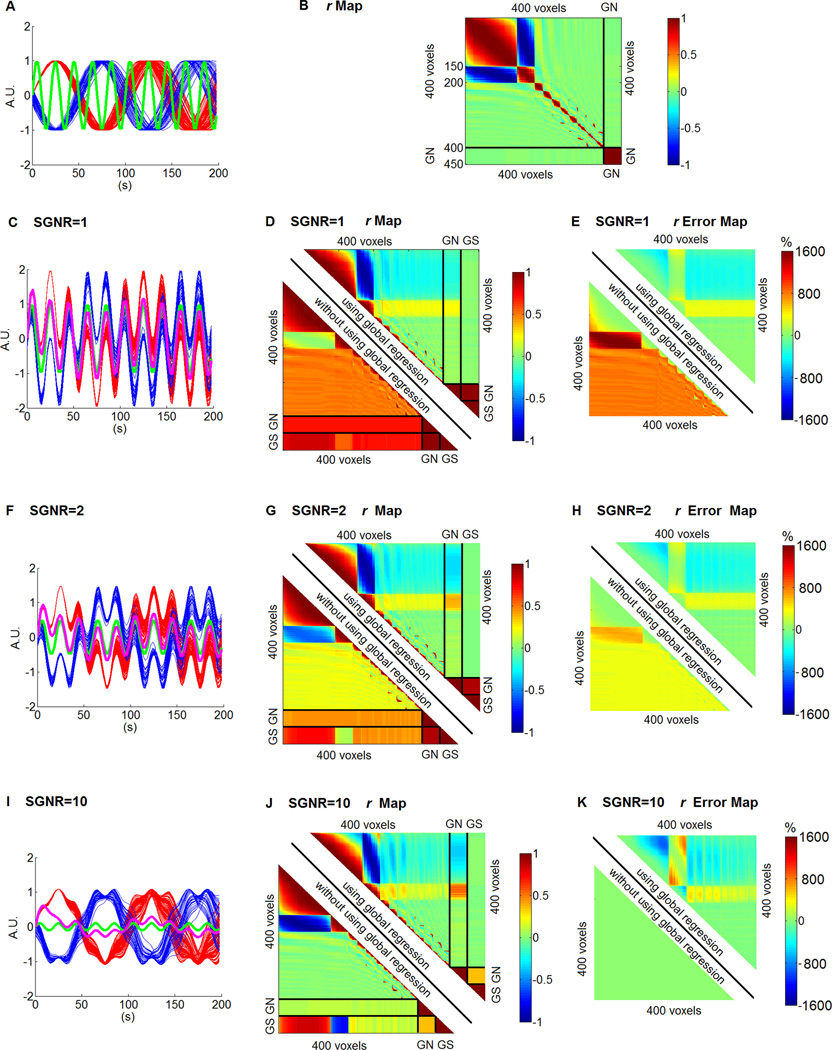
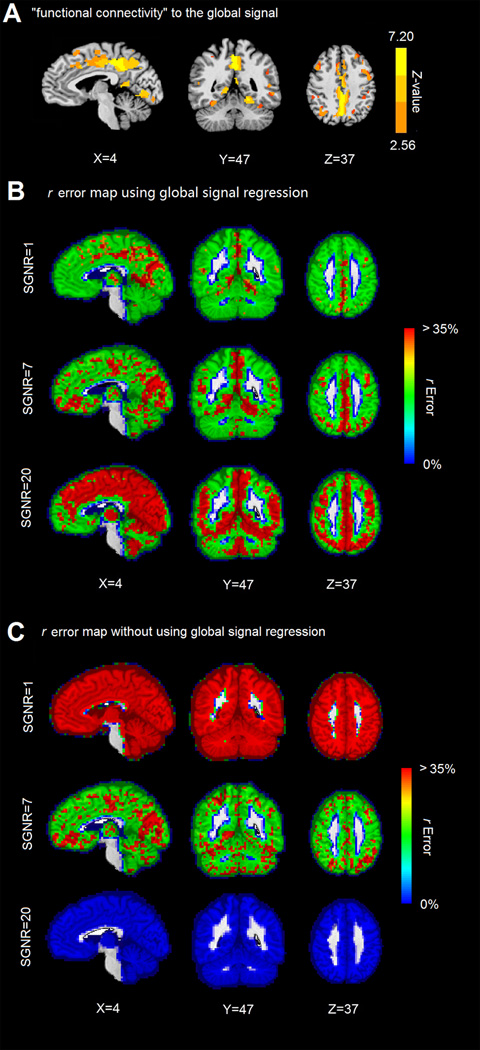
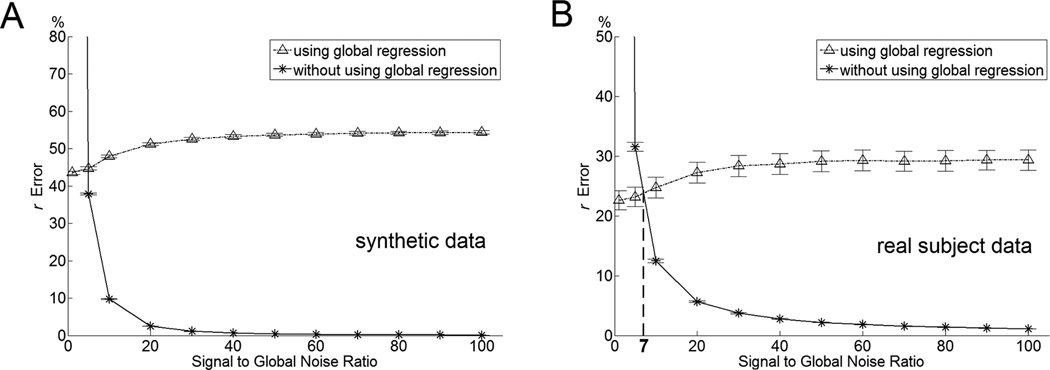
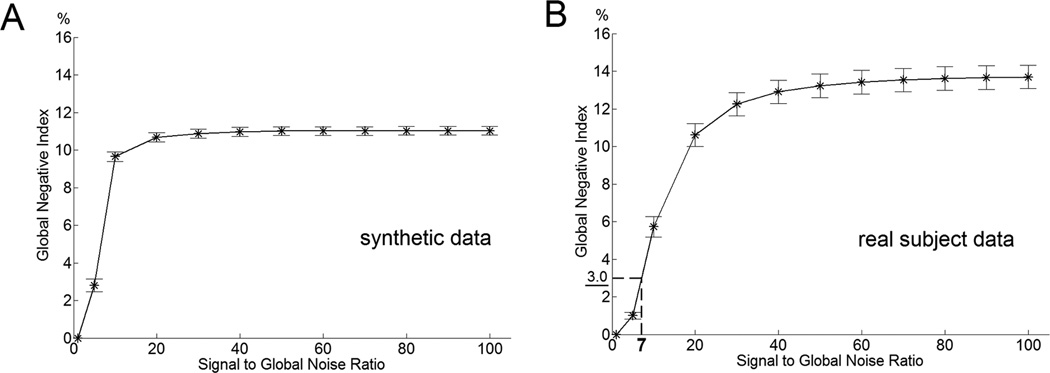
In resting-state functional MRI studies, the global signal (operationally defined as the global average of resting-state functional MRI time courses) is often considered a nuisance effect and commonly removed in preprocessing. This global signal regression method can introduce artifacts, such as false anticorrelated resting-state networks in functional connectivity analyses. Therefore, the efficacy of this technique as a correction tool remains questionable. In this article, we establish that the accuracy of the estimated global signal is determined by the level of global noise (i.e., non-neural noise that has a global effect on the resting-state functional MRI signal). When the global noise level is low, the global signal resembles the resting-state functional MRI time courses of the largest cluster, but not those of the global noise. Using real data, we demonstrate that the global signal is strongly correlated with the default mode network components and has biological significance. These results call into question whether or not global signal regression should be applied. We introduce a method to quantify global noise levels. We show that a criteria for global signal regression can be found based on the method. By using the criteria, one can determine whether to include or exclude the global signal regression in minimizing errors in functional connectivity measures.
Copyright © 2012 Wiley Periodicals, Inc.
Conflict of interest statement
Figures
References
-
- Biswal BB, Mennes M, Zuo XN, Gohel S, Kelly C, Smith SM, Beckmann CF, Adelstein JS, Buckner RL, Colcombe S, Dogonowski AM, Ernst M, Fair D, Hampson M, Hoptman MJ, Hyde JS, Kiviniemi VJ, Kotter R, Li SJ, Lin CP, Lowe MJ, Mackay C, Madden DJ, Madsen KH, Margulies DS, Mayberg HS, McMahon K, Monk CS, Mostofsky SH, Nagel BJ, Pekar JJ, Peltier SJ, Petersen SE, Riedl V, Rombouts SA, Rypma B, Schlaggar BL, Schmidt S, Seidler RD, Siegle GJ, Sorg C, Teng GJ, Veijola J, Villringer A, Walter M, Wang L, Weng XC, Whitfield-Gabrieli S, Williamson P, Windischberger C, Zang YF, Zhang HY, Castellanos FX, Milham MP. Toward discovery science of human brain function. Proc Natl Acad Sci U S A. 2010;107(10):4734–4739. - PMC - PubMed
-
- Buckner RL, Vincent JL. Unrest at rest: default activity and spontaneous network correlations. Neuroimage. 2007;37(4):1091–1096. discussion 1097–1099. - PubMed
-
- Fox MD, Raichle ME. Spontaneous fluctuations in brain activity observed with functional magnetic resonance imaging. Nat Rev Neurosci. 2007;8(9):700–711. - PubMed
Publication types
MeSH terms
Grants and funding
LinkOut - more resources
Full Text Sources
Medical
Miscellaneous
