. 2012 Jun;19(3):209-17.
doi: 10.1093/dnares/dss002. Epub 2012 Feb 14.

Accurate measurement of the relative abundance of different DNA species in complex DNA mixtures

Affiliations

Accurate measurement of the relative abundance of different DNA species in complex DNA mixtures

Sangkyun Jeong et al. DNA Res. 2012 Jun.

Abstract

A molecular tool that can compare the abundances of different DNA sequences is necessary for comparing intergenic or interspecific gene expression. We devised and verified such a tool using a quantitative competitive polymerase chain reaction approach. For this approach, we adapted a competitor array, an artificially made plasmid DNA in which all the competitor templates for the target DNAs are arranged with a defined ratio, and melting analysis for allele quantitation for accurate quantitation of the fractional ratios of competitively amplified DNAs. Assays on two sets of DNA mixtures with explicitly known compositional structures of the test sequences were performed. The resultant average relative errors of 0.059 and 0.021 emphasize the highly accurate nature of this method. Furthermore, the method's capability of obtaining biological data is demonstrated by the fact that it can illustrate the tissue-specific quantitative expression signatures of the three housekeeping genes G6pdx, Ubc, and Rps27 by using the forms of the relative abundances of their transcripts, and the differential preferences of Igf2 enhancers for each of the multiple Igf2 promoters for the transcription.


Figures
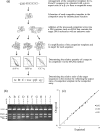
Figure 1.
Figure 1.
Determination of relative abundances of different DNA sequences. (a). A schematic representation of the entire procedure for determining the relative abundances among three sequences (A, B, and C) in a cDNA sample. The respective competitor templates (A′, B′, and C′) which are arranged in a competitor array with a given aspect ratio of α:β:γ are liberated by endonuclease restriction, mixed with cDNAs, and subjected to PCR reactions for each sequence of interest. The relative quantities of the target sequences with respect to the corresponding competitor in each amplicon, n, p, and q, as assessed by MAAQ, are fed into a calculation based on the aspect ratio of the competitor template in the competitor array to yield the relative abundances among the target sequences. (b). A set of artificial DNA mixtures constituted by the restriction of the plasmids (A–J) that contain cDNA fragments of three housekeeping genes with variable copy numbers as denoted under the name of the mixtures and fractionated on an agarose gel. The identity of each DNA is denoted on the left. (c). The relative abundances of two cDNA sequences were determined and scatter-plotted against the expected values on the log scale axes.
Figure 2.
Figure 2.
Relative abundances among the transcripts of three housekeeping genes that display tissue-specific expression signatures. (a) A plot of the relative expression ratios of two of the three housekeeping genes in three adult tissue samples as determined from three individuals. The error bar denotes the standard deviations among the individuals. (b) A plot of the relative expression ratio as determined from multiple RT reactions of a single individual; the plot highlights the precision of the assay. The error bar denotes the standard deviations among multiple RT reactions.
Figure 3.
Figure 3.
Promoter-specific transcriptions as measured in relation to the total transcription level. (a) The fetal Igf2 expression as derived from the promoters P1, P2, and P3. Each exon (E1, E2, and E3) constitutes a promoter-specific part of Igf2 mRNA that is spliced to the shared exon E4. The primers (arrows with dotted line in the middle) were designed to span two consecutive exons except for one forward primer, Igf2-E4F, which is placed on the 5′-most part of exon E4 to account for the total transcription of Igf2 and the common reverse primer. The detailed structure of the exon E4–exon E5 junction region regarding the positions of the reverse primers Igf2-E4R1 and Igf2-E4R2 and the FRET probes Igf2-A and Igf2-S is depicted in the lower part of the figure. (b) The relative quantities of the promoter-specific transcription with respect to the total transcription yield the relative abundance of each transcript in the samples. The relative transcript levels, which were measured from muscle tissue and liver tissue, represent the mesodermal and endodermal origins, respectively.

Similar articles

Cited by

References

    1. Cheung V.G., Spielman R.S. Genetics of human gene expression: mapping DNA variants that influence gene expression. Nat. Rev. Genet. 2009;10:595–604. - PMC - PubMed
    1. Schena M., Shalon D., Davis R.W., Brown P.O. Quantitative monitoring of gene expression patterns with a complementary DNA microarray. Science. 1995;270:467–70. - PubMed
    1. Marioni J.C., Mason C.E., Mane S.M., Stephens M., Gilad Y. RNA-seq: an assessment of technical reproducibility and comparison with gene expression arrays. Genome Res. 2008;18:1509–17. - PMC - PubMed
    1. Tan P.K., Downey T.J., Spitznagel E.L., Jr, et al. Evaluation of gene expression measurements from commercial microarray platforms. Nucleic Acids Res. 2003;31:5676–84. - PMC - PubMed
    1. Wang Y., Barbacioru C., Hyland F., et al. Large scale real-time PCR validation on gene expression measurements from two commercial long-oligonucleotide microarrays. BMC Genomics. 2006;7:59. - PMC - PubMed

Publication types