. 2012 Mar 30;287(14):10761-70.
doi: 10.1074/jbc.M111.306738. Epub 2012 Feb 13.

Carbon monoxide modulates apoptosis by reinforcing oxidative metabolism in astrocytes: role of Bcl-2

Affiliations

Carbon monoxide modulates apoptosis by reinforcing oxidative metabolism in astrocytes: role of Bcl-2

Ana S Almeida et al. J Biol Chem. .

Abstract

Modulation of cerebral cell metabolism for improving the outcome of hypoxia-ischemia and reperfusion is a strategy yet to be explored. Because carbon monoxide (CO) is known to prevent cerebral cell death; herein the role of CO in the modulation of astrocytic metabolism, in particular, at the level of mitochondria was investigated. Low concentrations of CO partially inhibited oxidative stress-induced apoptosis in astrocytes, by preventing caspase-3 activation, mitochondrial potential depolarization, and plasmatic membrane permeability. CO exposure enhanced intracellular ATP generation, which was accompanied by an increase on specific oxygen consumption, a decrease on lactate production, and a reduction of glucose use, indicating an improvement of oxidative phosphorylation. Accordingly, CO increased cytochrome c oxidase (COX) enzymatic specific activity and stimulated mitochondrial biogenesis. In astrocytes, COX interacts with Bcl-2, which was verified by immunoprecipitation; this interaction is superior after 24 h of CO treatment. Furthermore, CO enhanced Bcl-2 expression in astrocytes. By silencing Bcl-2 expression with siRNA transfection, CO effects in astrocytes were prevented, namely: (i) inhibition of apoptosis, (ii) increase on ATP generation, (iii) stimulation of COX activity, and (iv) mitochondrial biogenesis. Thus, Bcl-2 expression is crucial for CO modulation of oxidative metabolism and for conferring cytoprotection. In conclusion, CO protects astrocytes against oxidative stress-induced apoptosis by improving metabolism functioning, particularly mitochondrial oxidative phosphorylation.


Figures

FIGURE 1.
FIGURE 1.
Carbon monoxide confers protection against apoptosis. Primary cultures of astrocytes cultured in 24-well plates were pretreated with 50 μm of CO for 3 h, following apoptosis induction by 20 h of exposure to the pro-oxidant, t-BHP (from 0 to 240 μm). The apoptotic hallmarks were assessed by flow cytometry. In A, the percentage of cells presenting high mitochondrial potential (detected by DiOC6(3)) and containing intact plasma membrane (assessed with propidium iodide) is presented. All values are mean ± S.D. (n = 4). *, p < 0.05 compared with control and CO-treated cells for each concentration of t-BHP. B, representative picture of immunodetection of caspase-3 activation by its cleavage into the 17-kDa fraction. The first line corresponds to astrocytes treated with t-BHP at 160 μm (20 h); the second line astrocytes pretreated with 50 μm of CO (3 h) followed by t-BHP induction of apoptosis.
FIGURE 2.
FIGURE 2.
CO increases ATP generation in astrocytes. Astrocytes were treated with 50 μm of CO for 3 and 24 h, followed by ATP assessment. ATP concentration is represented per μg of protein from cellular extract. All values are mean ± S.D. (n = 3). *, p < 0.05 compared with control and CO-treated cells for 3 and 24 h. Ctr, control.
FIGURE 3.
FIGURE 3.
Effect of CO on ATP production and protection against cell death under glycolysis-limiting conditions. Astrocytes were cultured in glucose-free medium complemented with 2 mm deoxyglucose (for inhibiting small amounts of glucose presented in FBS) (A and B) and glucose-free medium with deoxyglucose and 2 mm pyruvate (for directly feeding the TCA cycle) (A and C) for 2 h. A, astrocytes were treated with 50 μm CO for 3 and 24 h, followed by ATP assessment. ATP concentration is represented per μg of protein from cellular extract. All values are mean ± S.D. (n = 3). *, p < 0.05 compared with control and CO-treated cells for 3 and 24 h, under normal conditions and glycolysis-limiting conditions. After culturing astrocytes in glucose-free medium complemented with 2 mm deoxyglucose (B) and glucose-free medium with deoxyglucose and 2 mm pyruvate (C) for 2 h, 50 μm CO was added for 3 h, followed by cell death induction with t-BHP (0 to 240 μm). The apoptotic hallmarks were assessed by flow cytometry as in Fig. 1. All values are mean ± S.D. (n = 3). *, p < 0.05 compared with control and CO-treated cells for each concentration of t-BHP.
FIGURE 4.
FIGURE 4.
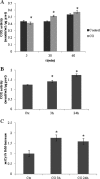
Effect of CO on cytochrome c oxidase activity and mitochondria biogenesis. A, non-synaptic mitochondria were isolated from rat cortex, 100 μg were treated with 10 μm CO, and COX enzymatic activity was assessed at 5, 30, and 60 min. All values are mean ± S.D. (n = 3). *, p < 0.05 compared with control and CO-treated cells for 5, 30, and 60 min. B, astrocytes were treated with 50 μm CO for 3 and 24 h, followed by mitochondria isolation (100 μg) and COX activity measurements. All values are mean ± S.D. (n = 3). *, p < 0.05 compared with control and CO-treated cells for 3 and 24 h. C, astrocytes were treated with 50 μm of CO for 3 and 24 h, followed by DNA extraction for measuring mitochondrial cytochrome b (mtCyt b) gene to assess mitochondrial DNA amount, which is represented by fold increase when compared with control without CO treatment. All values are mean ± S.D. (n = 4). *, p < 0.05 compared with control and CO-treated cells for 3 and 24 h. munits, milliunits; prot, protein; Ctr, control.
FIGURE 5.
FIGURE 5.
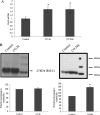
Role of CO in expression of Bcl-2 and Bcl-2-COX interaction. A, mRNA of Bcl-2 was quantified at 3 and 24 h of CO treatment at 50 μm. Values are represented in comparison with control astrocytes without CO treatment. All values are mean ± S.D. (n = 3). *, p < 0.05 compared with control and CO-treated cells for 3 and 24 h. B, COX was immunoprecipitated in mitochondria isolated from astrocytes treated with CO at 50 μm for 3 and 24 h, and Bcl-2 was immunodetected by Western blot from the immunoprecipitated proteins. The area and intensity of bands were quantified by densitometry analysis (GraphPad Prism 4) and are presented as relative percentage to the positive control (100%). All values are mean ± S.D. (n = 3). *, p < 0.05 compared with control and CO-treated cells for 24 h.
FIGURE 6.
FIGURE 6.
Role of Bcl-2 in CO-induced astrocytic metabolism modulation. Bcl-2 expression was silenced by siRNA transfection, and CO treatment was performed between 24 and 48 h after transfection, which is the period when gene silencing is optimal. Control and Bcl-2-silenced astrocytes were treated with CO for 3 h and challenged to death with 160 μm t-BHP for 20 h. A, cell death was assessed by flow cytometry (detected by DiOC6(3) and propidium iodide). All values are mean ± S.D. (n = 4). *, p < 0.05 compared with control and CO-treated cells; #, p < 0.05 compared with Bcl-2 silenced astrocytes and CO-treated Bcl-2-silenced astrocytes. B, representative picture of immunodetection of caspase-3 activation by its cleavage into a 12-kDa fraction. Astrocytes were challenged to death with 160 μm t-BHP (lane 1), pretreated with CO (lane 2), Bcl-2 was silenced and astrocytes were treated with t-BHP (lane 3), and Bcl-2-silenced astrocytes pretreated with CO followed by t-BHP cell death induction (lane 4). C, Bcl-2 silenced and control astrocytes were treated with 50 μm of CO for 3 h, followed by ATP assessment. ATP concentration is represented per μg of protein from cellular extract. All values are mean ± S.D. (n = 3). *, p < 0.05 compared with non-treated and CO-treated cells for 3 h; #, p < 0.05 compared with Bcl-2-silenced astrocytes and control astrocytes, both treated with CO. D, 100 μg of mitochondria were isolated from control astrocytes and Bcl-2-silenced astrocytes, both treated or not with 50 μm CO for 24 h for COX activity measurement. All values are mean ± S.D. (n = 5). *, p < 0.05 compared with control and CO-treated cells. E, Bcl-2-silenced and control astrocytes were treated with 50 μm CO for 3 and 24 h, followed by DNA extraction for measuring mitochondrial cytochrome (mtCyt) b gene to assess mitochondrial DNA amount, which is represented by fold increase when compared with control without Bcl-2 silencing and CO treatment. All values are mean ± S.D. (n = 4). *, p < 0.05 compared with control and CO-treated cells; #, p < 0.05 compared with Bcl-2-silenced cells and non-silenced astrocytes for 3 and 24 h. prot, protein; munit, milliunits; Ctr, control.

Similar articles

Cited by

References

    1. Motterlini R., Otterbein L. E. (2010) The therapeutic potential of carbon monoxide. Nat. Rev. Drug Discov. 9, 728–743 - PubMed
    1. Soares M. P., Bach F. H. (2009) Heme oxygenase-1: From biology to therapeutic potential. Trends Mol. Med. 15, 50–58 - PubMed
    1. Bannenberg G. L., Vieira H. L. (2009) Therapeutic applications of the gaseous mediators carbon monoxide and hydrogen sulfide. Expert. Opin. Ther. Pat. 19, 663–682 - PubMed
    1. Ryter S. W., Alam J., Choi A. M. (2006) Heme oxygenase-1/carbon monoxide: From basic science to therapeutic applications. Physiol. Rev. 86, 583–650 - PubMed
    1. Zhang X., Shan P., Alam J., Davis R. J., Flavell R. A., Lee P. J. (2003) Carbon monoxide modulates Fas/Fas ligand, caspases, and Bcl-2 family proteins via the p38α mitogen-activated protein kinase pathway during ischemia-reperfusion lung injury. J. Biol. Chem. 278, 22061–22070 - PubMed

Publication types

MeSH terms

Substances