. 2012 Apr 6;287(15):11778-87.
doi: 10.1074/jbc.M111.312819. Epub 2012 Feb 10.

N- and C-terminal domains determine differential nucleosomal binding geometry and affinity of linker histone isotypes H1(0) and H1c

Affiliations

N- and C-terminal domains determine differential nucleosomal binding geometry and affinity of linker histone isotypes H1(0) and H1c

Payal Vyas et al. J Biol Chem. .

Abstract

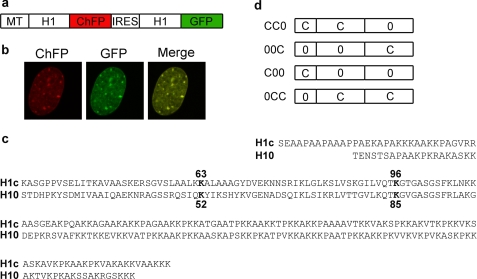
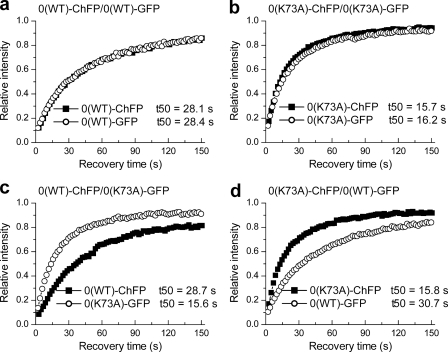
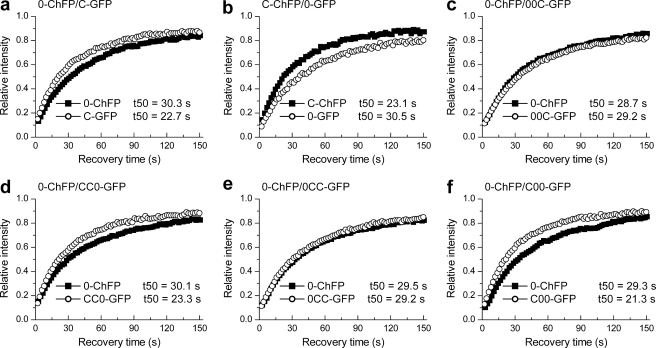
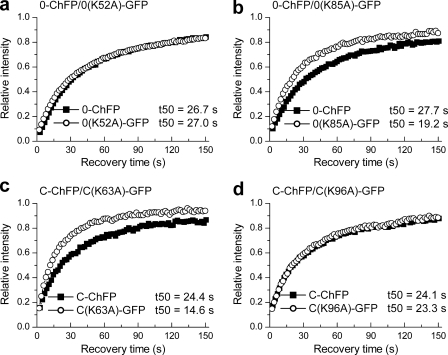
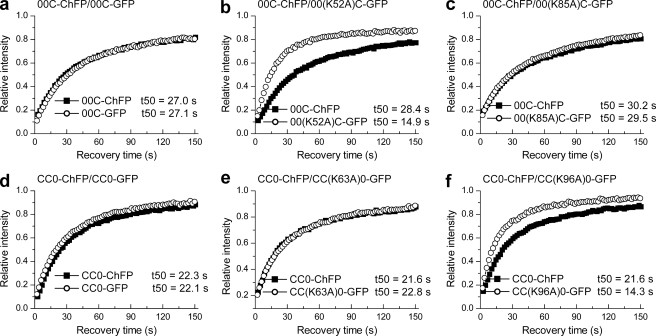
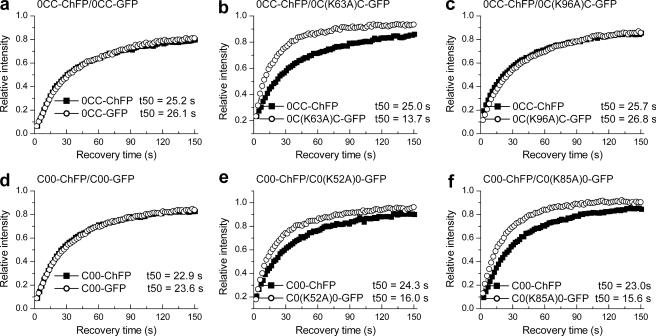
Eukaryotic linker or H1 histones modulate DNA compaction and gene expression in vivo. In mammals, these proteins exist as multiple isotypes with distinct properties, suggesting a functional significance to the heterogeneity. Linker histones typically have a tripartite structure composed of a conserved central globular domain flanked by a highly variable short N-terminal domain and a longer highly basic C-terminal domain. We hypothesized that the variable terminal domains of individual subtypes contribute to their functional heterogeneity by influencing chromatin binding interactions. We developed a novel dual color fluorescence recovery after photobleaching assay system in which two H1 proteins fused to spectrally separable fluorescent proteins can be co-expressed and their independent binding kinetics simultaneously monitored in a single cell. This approach was combined with domain swap and point mutagenesis to determine the roles of the terminal domains in the differential binding characteristics of the linker histone isotypes, mouse H1(0) and H1c. Exchanging the N-terminal domains between H1(0) and H1c changed their overall binding affinity to that of the other variant. In contrast, switching the C-terminal domains altered the chromatin interaction surface of the globular domain. These results indicate that linker histone subtypes bind to chromatin in an intrinsically specific manner and that the highly variable terminal domains contribute to differences between subtypes. The methods developed in this study will have broad applications in studying dynamic properties of additional histone subtypes and other mobile proteins.


Figures

FIGURE 1.
FIGURE 1.
Simultaneous expression of two linker histones in the nucleus of a single cell. a, bicistronic expression vectors contain the mouse metallothionein I promoter (MT) driving expression of a mRNA containing an ORF encoding H1-ChFP, an internal ribosome entry site (IRES) sequence, and a second ORF encoding H1-GFP. b, images acquired by live cell confocal microscopy of a cell expressing H10-ChFP and H10-GFP. c, sequence alignment of H1c and H10. Top two lines, N-terminal domains. Second two lines, central globular domains. Last four lines, C-terminal domains. Residues in bold type were mutagenized to alanine for constructs used in Fig. 5. d, schematic of domain switch mutants. Construct CC0 consists of amino acids 1–109 of H1c and amino acids 98–193 of H10. Construct 00C consists of amino acids 1–97 of H10 and amino acids 110–211 of H1c. Construct C00 consists of amino acids 1–32 of H1c and amino acids 21–193 of H10. Construct 0CC consists of amino acids 1–20 of H10 and amino acids 32–211 of H1c.
FIGURE 2.
FIGURE 2.
Validation of the dual color FRAP approach. a–d, quantitative dual color FRAP analysis of stable transfectants co-expressing WT H10-ChFP and WT H10-GFP (a), H10(K73A)-ChFP and H10(K73A)-GFP (b), WT H10-ChFP and H10(K73A)-GFP (c), and H10(K73A)-ChFP and WT H10-GFP (d). The values for the half-time of recovery (t50) were determined as previously described (35) and represent the means ± S.D. of at least eight independent measurements from a pool of three stable cell lines. The error bars are omitted from the plots for clarity. Table 1 provides the corresponding statistical analyses.
FIGURE 3.
FIGURE 3.
Quantitative analysis of the relative binding kinetics of isotypes H10 and H1c and effects of swapping their terminal domains. a and b, FRAP analysis with cells co-expressing WT H10-ChFP and WT H1c-GFP (a) or WT H10-GFP and WT H1c-ChFP (b) shows faster recovery kinetics for H1c than H10. c–f, simultaneous recovery curves of the C-terminal switch mutants 00C-GFP relative to WT H10-ChFP (c) and CC0-GFP relative to WT H10-ChFP (d) and of the N-terminal switch mutants 0CC-GFP relative to WT H10-ChFP (e) and C00-GFP relative to WT H10-ChFP (f). The values for the half-time of recovery (t50) were determined as previously described (35) and represent the means ± S.D. of at least eight independent measurements from a pool of three stable cell lines. The error bars are omitted from the plots for clarity. Table 2 provides the corresponding statistical analyses.
FIGURE 4.
FIGURE 4.
Identification of conserved residues in the globular domains of H10 and H1c showing differential binding behavior. a and b, plots showing recovery kinetics of H10 mutants H10(K52A)-GFP (a) and H10(K85A)-GFP (b), relative to co-expressed H10-ChFP. c and d, plots showing recovery kinetics of H1c mutants H1c(K63A)-GFP (c) and H1c(K96A)-GFP (d), relative to co-expressed H1c-ChFP. The values for the half-time of recovery (t50) were determined as previously described (35) and represent the means ± S.D. of at least eight independent measurements from a pool of three stable cell lines. The error bars are omitted from the plots for clarity. Table 2 provides the corresponding statistical analyses.
FIGURE 5.
FIGURE 5.
Quantitative FRAP analysis on cells expressing C-terminal domain swap bearing mutations in the globular domain. a–f, dual color FRAP analysis with cells co-expressing 00C-GFP and 00C-ChFP (a), 00(K52A)C-GFP and 00C-ChFP (b), 00(K85A)C-GFP and 00C-ChFP (c), CC0-GFP and CC0-ChFP (d), CC(K63A)0-GFP and CC0-ChFP (e), and CC(K96A)0-GFP and CC0-ChFP (f). The values for the half-time of recovery (t50) were determined as previously described (35) and represent the means ± S.D. of at least eight independent measurements from a pool of three stable cell lines. The error bars are omitted from the plots for clarity. Table 2 provides the corresponding statistical analyses.
FIGURE 6.
FIGURE 6.
Quantitative FRAP analysis on cells expressing N-terminal domain swap bearing mutations in the globular domain. a–f, dual color FRAP analysis with cells co-expressing 0CC-GFP and 0CC-ChFP (a), 0C(K63A)C-GFP and 0CC-ChFP (b), 0C(K96A)C-GFP and 0CC-ChFP (c), C00-GFP and C00-ChFP (d), C0(K52A)0-GFP and C00-ChFP (e), and C0(K85A)0-GFP and C00-ChFP (f). The values for the half-time of recovery (t50) were determined as previously described (35) and represent the means ± S.D. of at least eight independent measurements from a pool of three stable cell lines. The error bars are omitted from the plots for clarity. Table 2 provides the corresponding statistical analyses.

References

    1. van Holde K. (1989) Chromatin, Springer-Verlag, New York
    1. Luger K., Hansen J. C. (2005) Nucleosome and chromatin fiber dynamics. Curr. Opin. Struct. Biol. 15, 188–196 - PubMed
    1. Luger K., Mäder A. W., Richmond R. K., Sargent D. F., Richmond T. J. (1997) Crystal structure of the nucleosome core particle at 2.8 A resolution. Nature 389, 251–260 - PubMed
    1. Woodcock C. L. (2006) Chromatin architecture. Curr. Opin. Struct. Biol. 16, 213–220 - PubMed
    1. Hansen J. C., Nyborg J. K., Luger K., Stargell L. A. (2010) Histone chaperones, histone acetylation, and the fluidity of the chromogenome. J. Cell Physiol. 224, 289–299 - PMC - PubMed

Publication types

LinkOut - more resources