. 2012 Mar 30;287(14):11261-71.
doi: 10.1074/jbc.M111.310953. Epub 2012 Feb 10.

Extracellular low pH modulates phosphatidylserine-dependent phagocytosis in macrophages by increasing stabilin-1 expression

Affiliations

Extracellular low pH modulates phosphatidylserine-dependent phagocytosis in macrophages by increasing stabilin-1 expression

Seung-Yoon Park et al. J Biol Chem. .

Abstract

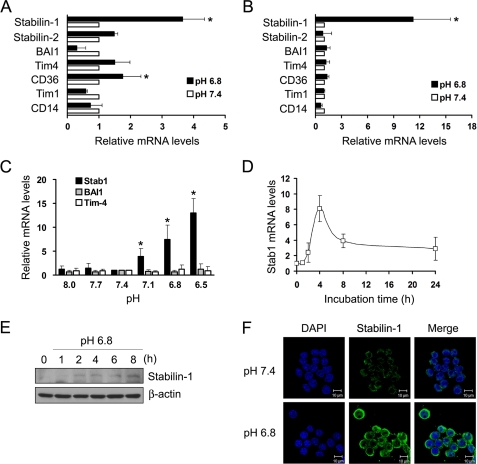
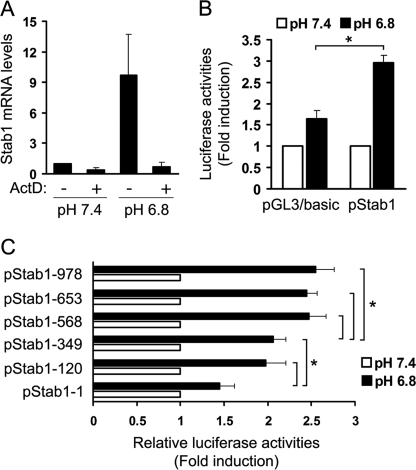
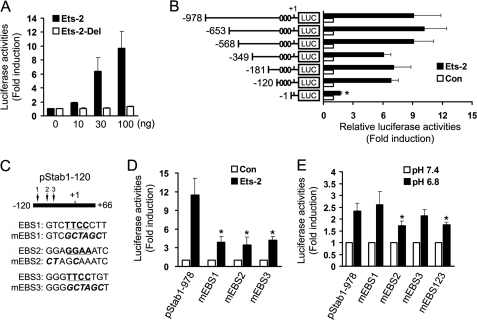
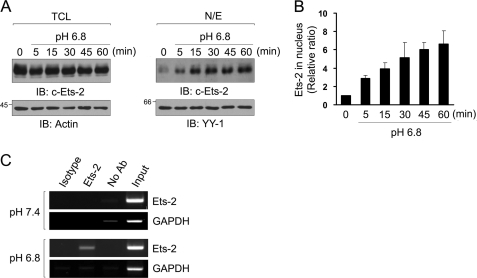
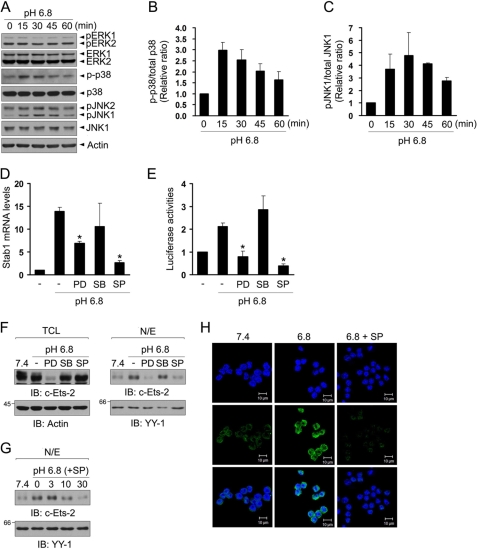
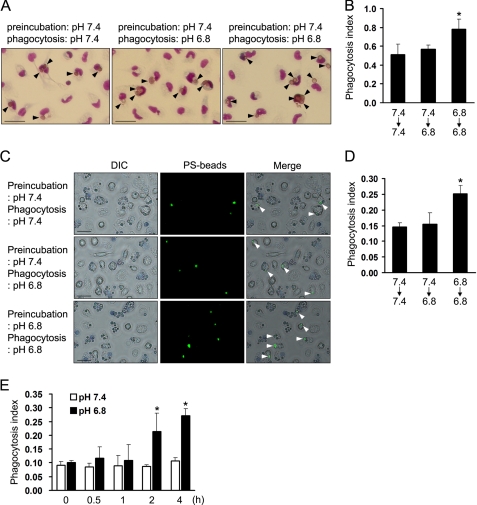
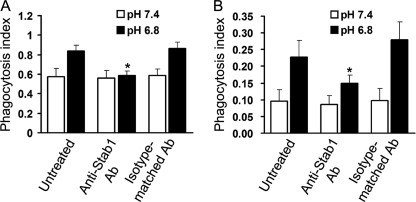
Microenvironmental acidosis is a common feature of inflammatory loci, in which clearance of apoptotic cells is necessary for the resolution of inflammation. Although it is known that a low pH environment affects immune function, its effect on apoptotic cell clearance by macrophages has not been fully investigated. Here, we show that treatment of macrophages with low pH medium resulted in increased expression of stabilin-1 out of several receptors, which are known to be involved in PS-dependent removal of apoptotic cells. Reporter assays showed that the -120/-1 region of the mouse stabilin-1 promoter was a low pH-responsive region and provided evidence that extracellular low pH mediated transcriptional activation of stabilin-1 via Ets-2. Furthermore, extracellular low pH activated JNK, thereby inducing translocation of Ets-2 into the nucleus. When macrophages were preincubated with low pH medium, phagocytosis of phosphatidylserine-exposed red blood cells and phosphatidylserine-coated beads by macrophages was enhanced. Blockade of stabilin-1 in macrophages abolished the enhancement of phagocytic activity by low pH. Thus, our results demonstrate that a low pH microenvironment up-regulates stabilin-1 expression in macrophages, thereby modulating the phagocytic capacity of macrophages, and suggest roles for stabilin-1 and Ets-2 in the maintenance of tissue homeostasis by the immune system.


Figures

FIGURE 1.
FIGURE 1.
Expression of stabilin-1 is specifically increased by extracellular low pH. A and B, expression of PS recognition receptors in neutral or low pH medium was examined in peritoneal macrophages (A) and Raw264.7 cells (B) using quantitative real time PCR. The relative expression levels were plotted against that of each gene in neutral pH medium, which was set as 1. The results are expressed as the means ± S.D. from three independent experiments. t test: *, p < 0.01. C, expression of Stab1, Tim-4, and BAI1 in different pH medium. Raw264.7 cells were incubated in the indicated pH medium for 4 h, and expression of Stabilin-1, Tim-4, and BAI1 mRNA was examined by quantitative real time PCR. The results are expressed as the means ± S.D. from three independent experiments. D, Raw264.7 cells were incubated in low pH medium for the indicated times, and expression of stabilin-1 mRNA was examined by quantitative real time PCR. The results are expressed as the means ± S.D. from three independent experiments. E, Raw264.7 cells were incubated in low pH medium for the indicated times, and expression of stabilin-1 protein was examined by Western blotting. F, Raw264.7 cells were incubated in neutral or low pH medium for 4 h, and expression of stabilin-1 protein was examined by immunostaining using anti-stabilin-1 antibody (1bR1). Scale bar, 10 μm.
FIGURE 2.
FIGURE 2.
Expression of stabilin-1 is increased by extracellular low pH. A, Raw264.7 cells were preincubated with or without actinomycin D (ActD), a transcriptional inhibitor, and then incubated with neutral or low pH medium for 4 h. Expression of stabilin-1 mRNA was examined by quantitative real time PCR. The results are expressed as the means ± S.D. from three independent experiments. B, analysis of mouse stabilin-1 promoter activity under neutral or low pH conditions. The activity of a luciferase reporter gene driven by the mouse stabilin-1 promoter was measured after transfection of Raw264.7 cells with pStab1 or pGL3/basic vector. Luciferase activity was normalized to Renilla luciferase activity and is shown as the fold increase in luciferase activity over that obtained under neutral pH. The results are expressed as the means ± S.D of three independent experiments. t test: *, p < 0.05. C, the full-length (−978/+66) mouse stabilin-1 promoter, as well as a series of 5′ deletion mutants, were transfected into Raw264.7 cells. At 12 h post-transfection, the cells were incubated with low pH medium for 16 h. The relative luciferase activities were plotted against that of each promoter in neutral pH medium, which was set as 1. The results are expressed as the means ± S.D. of at least three independent experiments. t test: *, p < 0.05.
FIGURE 3.
FIGURE 3.
Ets-2 is involved in transactivation of staiblin-1 at the −77/−66 region. A, the mouse stabilin-1 promoter construct was cotransfected with the indicated amount of wild-type or mutant Ets-2 expression vector into Raw264.7 cells. Relative luciferase activities were plotted against that of the mouse stabilin-1 promoter in the absence of Ets-2, which was set as 1. The results are expressed as the means ± S.D. of at least three independent experiments. B, identification of the Ets-2-responsive region of the mouse stabilin-1 promoter. The full-length mouse stabilin-1 promoter (−978/+66) and a series of 5′ deletion mutants were cotransfected with Ets-2 expression vector or empty vector into Raw264.7 cells. The relative luciferase activities were plotted against that of each promoter in the absence of Ets-2, which was set as 1. The results are expressed as the means ± S.D. of at least three independent experiments. Putative Ets-2-binding sites are indicated as ovals. t test: *, p < 0.01. C, schematic representation of putative EBS and their mutants in the mouse stabilin-1 promoter. D, the full-length mouse stabilin-1 promoter (−978/+66) and EBS mutants were cotransfected with Ets-2 expression vector into Raw264.7 cells. The relative luciferase activities were plotted against that of each promoter in the absence of Ets-2, which was set as 1. The results are expressed as the means ± S.D. of at least three independent experiments. t test: *, p < 0.01 versus wild-type promoter. E, the full-length mouse stabilin-1 promoter (−978/+66) and EBS mutants were transfected into Raw264.7 cells. At 12 h post-transfection, the cells were incubated with low pH medium for 16 h. The relative luciferase activities were plotted against that of each promoter in neutral pH medium, which was set as 1. The results are expressed as the means ± S.D. of at least three independent experiments. t test: *, p < 0.01 versus wild-type promoter. Con, control.
FIGURE 4.
FIGURE 4.
Extracellular low pH induces translocation of Ets-2, thereby binding to the Ets-2-responsive element. A, Raw264.7 cells were incubated in low pH medium for the indicated time, and the amounts of Ets-2 protein in total cell lysates (TCL, left panels) and nuclear extracts (N/E, right panels) were analyzed by Western blotting using an anti-Ets-2 antibody. B, immunoblot intensities for Ets-2 in the nuclear extracts were quantitated by densitometry and normalized by YY-1 intensity. The relative intensities are expressed in arbitrary units. The intensity of the zero time point was set to one. The results are expressed as the means ± S.D. of three independent experiments. C, chromatin immunoprecipitation assays. Raw264.7 cells were incubated in neutral or low pH medium for 1 h. Soluble chromatin was prepared from the cells and immunoprecipitated with anti-Ets-1/2 antibody (lane 2) or an isotype-matched control antibody (anti-Ets-1) (lane 1). Immunoprecipitates were subjected to PCR with primers corresponding to the EBS in the mouse stabilin-1 promoter. As a negative control, GAPDH primers were used. IB, immunoblot.
FIGURE 5.
FIGURE 5.
JNK is important for Ets-2-mediated stabilin-1 expression at low extracellular pH. A, Raw264.7 cells were stimulated with low pH medium for the indicated time. Total cell lysates were immunoblotted for phosphor-Erk, phosphor-p38 MAPK, and phosphor-JNK. A representative result of three independent experiments is shown. B and C, immunoblot intensities for p-p38/p38 (B) and pJNK/JNK (C) were quantitated by densitometry and expressed in arbitrary units. The intensity of the zero time point was set to one. The results are expressed as the means ± S.D. of three independent experiments. D, Raw264.7 cells were incubated with neutral or low pH medium for 4 h in the presence of the indicated MAPK inhibitors. Expression of stabilin-1 mRNA was analyzed by real time quantitative PCR. t test: *, p < 0.01. E, Raw264.7 cells were transfected with the stabilin-1 promoter construct and then incubated with low pH medium in the presence of the indicated MAPK inhibitors. The relative luciferase activities were plotted against that of the promoter in pH 7.4 medium, which was set as 1. The results are expressed as the mean ± S.D. of at least three independent experiments. t test: *, p < 0.01. F, Raw264.7 cells were incubated with neutral or low pH medium for 1 h in the presence of Erk1/2 (PD98059, PD), p38 (SB203580, SB), or JNK inhibitor (SP600125, SP), and the amounts of Ets-2 protein in total cell lysates (TCL, left panels) and nuclear extracts (N/E, right panels) were analyzed by immunoblotting (IB) using anti-Ets-2 antibody. G, Raw264.7 cells were incubated with neutral or low pH medium for 1 h in the presence of three different concentrations (3, 10, or 30 μm) of JNK inhibitor (SP600125), and the amount of Ets-2 protein in the nuclear extracts was analyzed by immunoblotting with anti-Ets-2 antibody. H, Raw264.7 cells were incubated in neutral or low pH medium for 4 h in the presence or absence of JNK inhibitor, and expression of stabilin-1 protein was examined by immunostaining using anti-stabilin-1 antibody (1bR1). Scale bar, 10 μm.
FIGURE 6.
FIGURE 6.
Extracellular low pH increases phagocytic activity of macrophages. A, representative images of PS-exposed RBC engulfment by peritoneal macrophages under the indicated conditions. The cells were preincubated with neutral or low pH medium for 4 h and then incubated with PS-exposed RBC for 1 h in neutral or low pH medium. Three independent experiments were performed, and a representative result is shown. The arrowheads indicate the engulfed PS-exposed RBC. Scale bar, 25 μm. B, phagocytosis assays were conducted under the indicated conditions using PS-exposed RBC as target cells, and the phagocytosis index (the number of engulfed cells per macrophage) was determined. The results are expressed as the means ± S.D. from three independent experiments. Analysis of variance: *, p < 0.05. C, representative images of PS bead engulfment by peritoneal macrophages under neutral or low pH conditions. The cells were preincubated with neutral or low pH medium for 4 h and then incubated with PS-coated beads for 1 h in neutral or low pH medium. PS beads engulfed in macrophages are shown in green (arrowheads). Three independent experiments were performed, and representative results are shown. Scale bar, 25 μm. DIC, differential interference contrast. D, phagocytosis assays were conducted under the indicated conditions, and the phagocytosis index (the number of engulfed beads per macrophage) was determined. The results are expressed as the means ± S.D. from three independent experiments. Analysis of variance: *, p < 0.05. E, Raw264.7 cells were preincubated with low pH medium for the indicated times and then incubated with PS-coated beads for 1 h in neutral or low pH medium. The phagocytosis index was determined and expressed as the means ± S.D. from three independent experiments. t test: *, p < 0.05 versus pH 7.4.
FIGURE 7.
FIGURE 7.
Stabilin-1-mediated phagocytosis is enhanced by extracellular low pH. A, peritoneal macrophages were treated with anti-stabilin-1 antibody (10 μg/ml) or an isotype-matched control antibody (10 μg/ml) prior to the addition of PS-exposed RBC. Phagocytosis assays were conducted under neutral or low pH conditions, and the phagocytosis index (the number of engulfed cells per macrophage) was determined. The results are expressed as the means ± S.D. from three independent experiments. t test: *, p < 0.05. B, Raw264.7 cells were treated with anti-stabilin-1 antibody (10 μg/ml) or an isotype-matched control antibody (10 μg/ml) prior to the addition of PS-coated beads. Phagocytosis assays were conducted under neutral or low pH conditions, and the phagocytosis index (the number of engulfed cells per macrophage) was determined. The results are expressed as the means ± S.D. from three independent experiments. t test: *, p < 0.05.

Similar articles

Cited by

References

    1. Dubos R. J. (1955) The micro-environment of inflammation or Metchnikoff revisited. Lancet 269, 1–5 - PubMed
    1. Kopaniak M. M., Issekutz A. C., Movat H. Z. (1980) Kinetics of acute inflammation induced by E. coli in rabbits. Quantitation of blood flow, enhanced vascular permeability, hemorrhage, and leukocyte accumulation. Am. J. Pathol. 98, 485–498 - PMC - PubMed
    1. Grimshaw M. J., Balkwill F. R. (2001) Inhibition of monocyte and macrophage chemotaxis by hypoxia and inflammation. A potential mechanism. Eur. J. Immunol. 31, 480–489 - PubMed
    1. van Zwieten R., Wever R., Hamers M. N., Weening R. S., Roos D. (1981) Extracellular proton release by stimulated neutrophils. J. Clin. Invest. 68, 310–313 - PMC - PubMed
    1. Edlow D. W., Sheldon W. H. (1971) The pH of inflammatory exudates. Proc. Soc. Exp. Biol. Med. 137, 1328–1332 - PubMed

Publication types