State and regional prevalence of sleep disturbance and daytime fatigue
- PMID: 22334813
- PMCID: PMC3266332
- DOI: 10.5664/jcsm.1668
State and regional prevalence of sleep disturbance and daytime fatigue
Abstract
Study objectives: Social and demographic influences are important for sleep attainment. Geographic location has not been previously explored.
Methods: Data from the 2006 Behavioral Risk Factor Surveillance System (BRFSS) were used (N = 157,319). Participants answered a question on Sleep Disturbance and Daytime Fatigue. Thirty-six states/regions provided data on these items. Prevalence estimates were adjusted for age, sex, ethnoracial group, education, income, employment, general health, healthcare access, and depression. Chi-squared tests were conducted across states and census regions, and pseudo-R(2) values were computed for the effect of state, relative to other predictors. To evaluate potential mediators of census region differences, an analysis of p value change associated with specific covariates and covariate groups was undertaken.
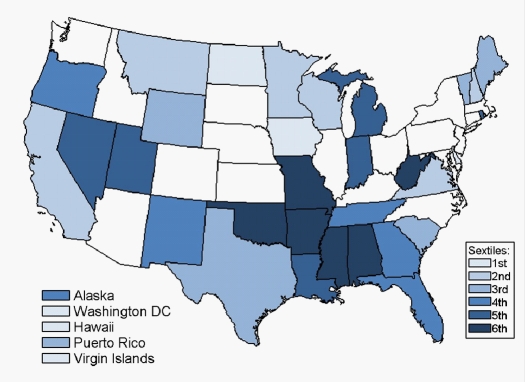
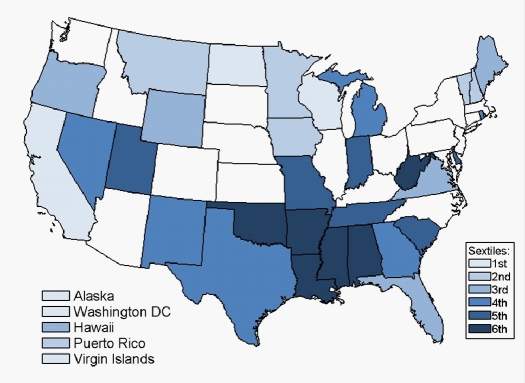
Results: Adjusted prevalence rates of Sleep Disturbance differed across states/regions overall (χ(2) = 412.3, p < 0.0001), as well as separately for men (χ(2) = 139.5, p < 0.0001) and women (χ(2) = 350.0, p < 0.0001), as did rates of Daytime Fatigue overall (χ(2) = 245.7, p < 0.0001), and separately for men (χ(2) = 117.5, p < 0.0001) and women (χ(2) = 181.2, p < 0.0001). Analysis of pseudo-R(2) values revealed that despite these significant findings, state differences were an overall weak predictor, representing 1.30% to 1.73% of the magnitude of the effect of the best predictor (mental health). When Census regions were compared, significant differences were found for Sleep Disturbance (p = 0.002), but after adjustment for covariates, these were no longer significant. Differences existed for Daytime Fatigue in adjusted analyses overall (p < 0.0001), with the West reporting the fewest complaints and the South reporting the most.
Conclusions: These results demonstrate that reports of sleep related complaints vary across states, independent (at least partially) of factors that influence circadian rhythms (e.g., latitude).
Keywords: Sleep; epidemiology; fatigue; geographic factors; health services.
Figures
References
-
- Suzuki E, Yorifuji T, Ueshima K, et al. Sleep duration, sleep quality and cardiovascular disease mortality among the elderly: A population-based cohort study. Prev Med. 2009 - PubMed
-
- Bixler E. Sleep and society: an epidemiological perspective. Sleep Med. 2009;10(Suppl 1):S3–6. - PubMed
-
- Staner L. Comorbidity of insomnia and depression. Sleep Med Rev. 2010;14:35–46. - PubMed
Publication types
MeSH terms
Grants and funding
LinkOut - more resources
Full Text Sources
Medical