. 2012 Jun;11(6):M111.016675.
doi: 10.1074/mcp.M111.016675. Epub 2012 Feb 14.

Systematic identification of the HSP90 candidate regulated proteome

Affiliations

Systematic identification of the HSP90 candidate regulated proteome

Zhixiang Wu et al. Mol Cell Proteomics. 2012 Jun.

Abstract

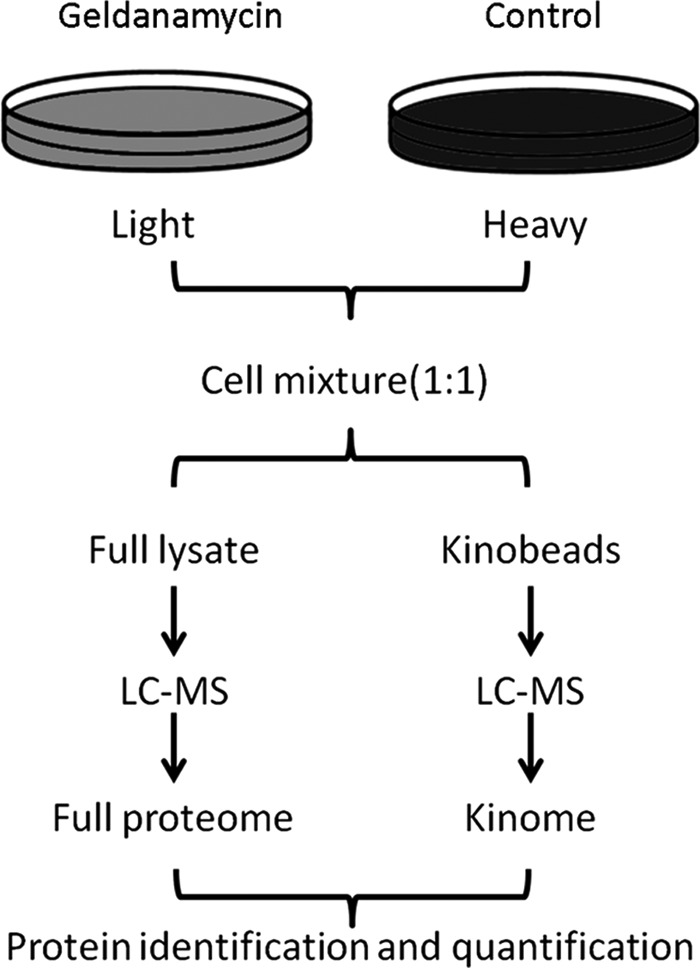
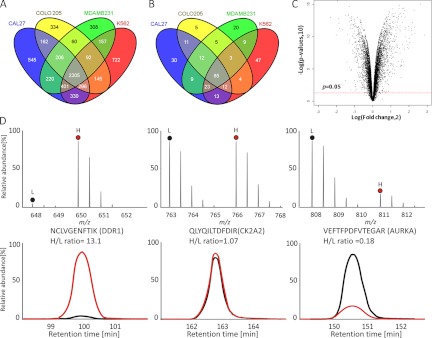
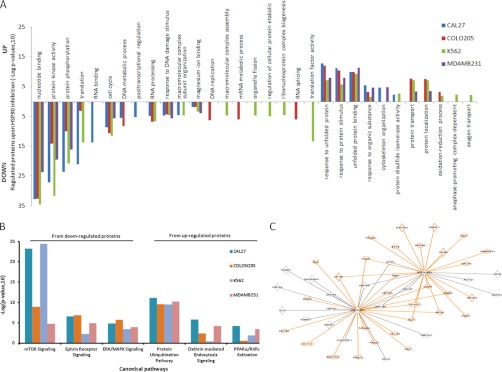
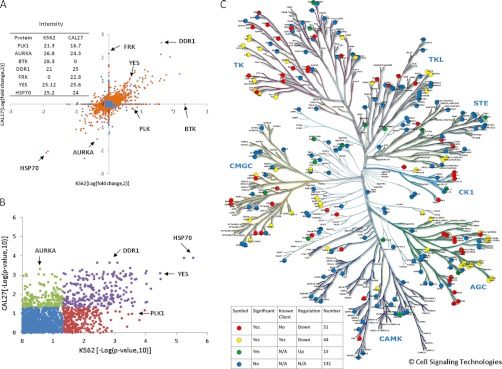
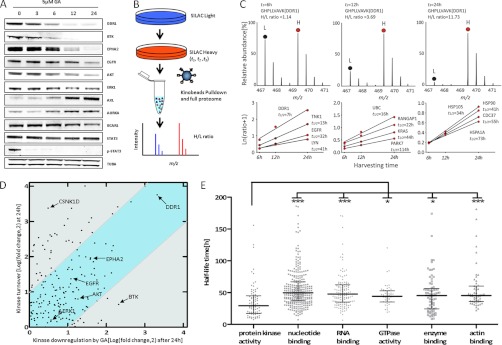
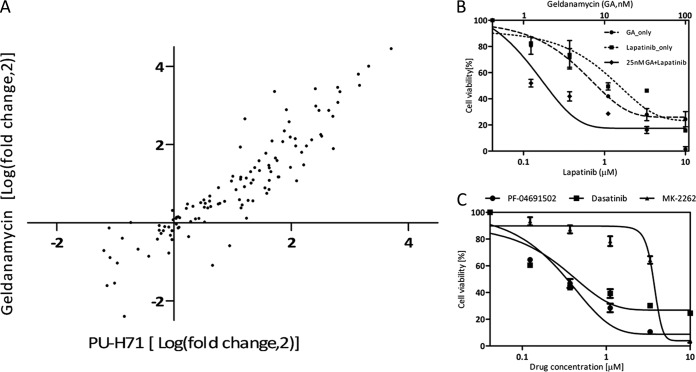
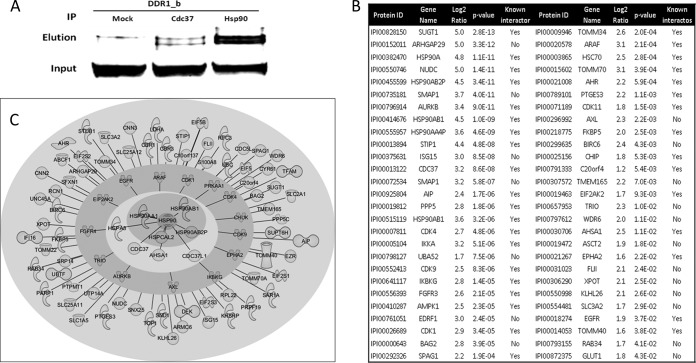
HSP90 is a central player in the folding and maturation of many proteins. More than two hundred HSP90 clients have been identified by classical biochemical techniques including important signaling proteins with high relevance to human cancer pathways. HSP90 inhibition has thus become an attractive therapeutic concept and multiple molecules are currently in clinical trials. It is therefore of fundamental biological and medical importance to identify, ideally, all HSP90 clients and HSP90 regulated proteins. To this end, we have taken a global and a chemical proteomic approach in geldanamycin treated cancer cell lines using stable isotope labeling with amino acids in cell culture and quantitative mass spectrometry. We identified >6200 proteins in four different human cell lines and ~1600 proteins showed significant regulation upon drug treatment. Gene ontology and pathway/network analysis revealed common and cell-type specific regulatory effects with strong connections to unfolded protein binding and protein kinase activity. Of the 288 identified protein kinases, 98 were geldanamycin treatment including >50 kinases not formerly known to be regulated by HSP90. Protein turn-over measurements using pulsed stable isotope labeling with amino acids in cell culture showed that protein down-regulation by HSP90 inhibition correlates with protein half-life in many cases. Protein kinases show significantly shorter half lives than other proteins highlighting both challenges and opportunities for HSP90 inhibition in cancer therapy. The proteomic responses of the HSP90 drugs geldanamycin and PU-H71 were highly similar suggesting that both drugs work by similar molecular mechanisms. Using HSP90 immunoprecipitation, we validated several kinases (AXL, DDR1, TRIO) and other signaling proteins (BIRC6, ISG15, FLII), as novel clients of HSP90. Taken together, our study broadly defines the cellular proteome response to HSP90 inhibition and provides a rich resource for further investigation relevant for the treatment of cancer.


Figures

Fig. 1.
Fig. 1.
Experimental strategy for the identification of the HSP90 regulated proteome. Cells are grown in “light” and “heavy” SIALC medium. Light cells are treated with the HSP90 inhibitor geldanamycin. Treated and untreated cells are combined and full lysates are either separated by 1D gel electrophoresis (left branch) or first subjected to purification of kinases using kinobeads (right branch). Following trypsin digestion, both samples are analyzed by LC-MS/MS and proteins are subsequently identified and quantified. Each experiment was performed in biological triplicates.
Fig. 2.
Fig. 2.
Quantitative analysis of protein expression in four human cancer cell lines. A, protein identification summary from the four human cancer cell lines Cal 27 (headandneck), Colo205 (colon), MDAMB231 (breast) and K562 (blood). B, kinase identification summary for the same cell lines. C, volcano plot summarizing the protein quantification results in terms of the magnitude (log2foldchange >0 indicates down-regulation upon drug treatment) and significance (p value of <0.05 indicated by red line) of the observed protein expression changes. D, Example mass spectra (upper panel) and extracted ion chromatograms (lower panel) of drug induced down-regulated (left), not regulated (middle) and up-regulated (right) proteins. L and H denote peptide species containing either light or heavy amino acids.
Fig. 3.
Fig. 3.
Bioinformatic analysis of the HSP90 regulated proteome part I. A, Results of GO term enrichment analysis of all four cell lines (colored). B, Example results of Ingenuity Pathway Analysis (IPA) across the geldanamycin regulated proteomes of the four cell lines analyzed. The histogram bars indicate the degree (significance) of overrepresentation of a particular pathway in a particular cell line. C, Binary protein-protein interaction map of HSP90alpha and HSP90beta extracted by IPA from the list of geldanamycin regulated proteins. Orange edges and nodes indicate down-regulation, black ones indicate up-regulation upon drug treatment (see supplemental Fig. S16 for a high resolution map).
Fig. 4.
Fig. 4.
Bioinformatic analysis of the HSP90 regulated proteome part II. A, Comparison of the cell lines Cal27 and K562 for the magnitude of protein regulation in response to HSP90 inhibition by geldanamycin (expressed as Log (fold change,2)). Proteins marked in orange show statistically significant regulation (p < 0.05), proteins marked in blue do not. B, same data as in (A) but here the significance of protein regulation is plotted (expressed as -Log (p value,10)). Proteins marked in blue show now significant response to HSP90 inhibition. Proteins marked in violet are significantly regulated in both cell lines. Proteins marked in green or red are significantly regulated in one of the two cell lines. Analogous plots for all cell line comparisons are shown in supplemental Figs. S17 and S18. C, Phylogenetic tree showing all protein kinases identified in this study. Kinases unaffected by HSP90 inhibition are marked in blue, up-regulated kinases in green, down-regulated known HSP90 clients in yellow, and down-regulated novel kinases in red (according to Piscard's list).
Fig. 5.
Fig. 5.
Kinetics of geldanamycin induced proteins removal from cancer cells. A, This Western blot time course analysis of cells treated with geldanamycin shows that proteins are removed from cells at different rates. B, Schematic representation of a pulsed SILAC experiment. Cells are labeled with heavy amino acids for six, twelve of 24 h. Light and heavy samples for each time point were combined, kinases enriched by kinobeads and all proteins were analyzed by MS. Newly synthesized proteins are detected as heavy peptides (red) whereas old proteins are detected as light peptides (blue). C, Example mass spectra (upper panel) used for protein half-life determinations of the receptor tyrosine kinase DDR1 and additional examples for other proteins (lower panel). D, Correlation plot of kinase protein turnover (24h pulsed SILAC) and levels of kinase regulation induced by geldanamycin (24h treatment). Kinases in the blue zone show good correlation between turn over and drug treatment suggesting that newly synthesized proteins are rapidly degraded upon drug treatment and that the measurable pool of cellular kinases is removed from cells at the rate of normal turn over. Cellular levels of kinases in the gray zone are regulated in a more complex fashion. E, Comparison of protein half lives by different protein classes. Kinases have significantly shorter half lives than other protein classes.
Fig. 6.
Fig. 6.
Pharmacological intervention with HSP90 regulated processes. A, comparison of kinase expression regulated by the two ATP binding site HSP90 inhibitors geldanamycin and PU-H71 in Cal27 cells. The strong correlation suggests that both drugs work by mechanisms leading to a very similar outcome. B, Combination of HSP90 inhibition with targeted kinase inhibition. Cal27 cells are growth dependent on the receptor tyrosine kinase EGFR. Combined treatment of Cal27 cells with geldanamycin and the EGFR inhibitor lapatinib kills cells more effectively than either drug alone. C, Targeting the PI3K/mTOR pathway in Cal27 cells. HSP90 inhibition strongly affects the PI3K/mTOR pathway in Cal27 cells (see Fig. 3B). The dual PI3K/mTOR inhibitor PF-04691502 kills Cal27 cells in an AKT independent fashion (indicated by the inability of the AKT inhibitor MK-2262 to kill the cells) and with similar efficacy as the unspecific kinase inhibitor dasatinib.
Fig. 7.
Fig. 7.
HSP90 interactome. A, Co-immunoprecipitation and Western blot analysis reveals that DDR1 is a physical interactor of the HSP90/CDC37 complex. B, Results of HSP90 co-immunoprecipitation experiments and quantitative MS analysis from SILAC labeled Cal27 and MDAMB231 cells. The analysis in biological triplicates allowed for the identification of ∼50 known and novel high confidence HSP90 interactors. C, Graphical representation of the HSP90 interactome as obtained in this study. HSP90 isoforms are shown in the center, surrounded by cochaperones in the next layer, kinases in the next layer and other proteins of diverse functions in the outer layer.

Similar articles

Cited by

References

    1. Taipale M., Jarosz D. F., Lindquist S. (2010) HSP90 at the hub of protein homeostasis: emerging mechanistic insights. Nat. Rev. Mol. Cell Biol. 11, 515–528 - PubMed
    1. Trepel J., Mollapour M., Giaccone G., Neckers L. (2010) Targeting the dynamic HSP90 complex in cancer. Nat. Rev. Cancer 10, 537–549 - PMC - PubMed
    1. Picard D. HSP90 interactors. http://www.picard.ch/downloads/Hsp90interactors.pdf
    1. Zhao R., Houry W. A. (2007) Molecular interaction network of the Hsp90 chaperone system. Adv. Exp. Med. Biol. 594, 27–36 - PubMed
    1. Whitesell L., Lindquist S. L. (2005) HSP90 and the chaperoning of cancer. Nat. Rev. Cancer 5, 761–772 - PubMed

Publication types