. 2012 Jul 26;120(4):709-19.
doi: 10.1182/blood-2012-01-403212. Epub 2012 Feb 14.

The thrombopoietin/MPL/Bcl-xL pathway is essential for survival and self-renewal in human preleukemia induced by AML1-ETO

Affiliations

The thrombopoietin/MPL/Bcl-xL pathway is essential for survival and self-renewal in human preleukemia induced by AML1-ETO

Fu-Sheng Chou et al. Blood. .

Abstract

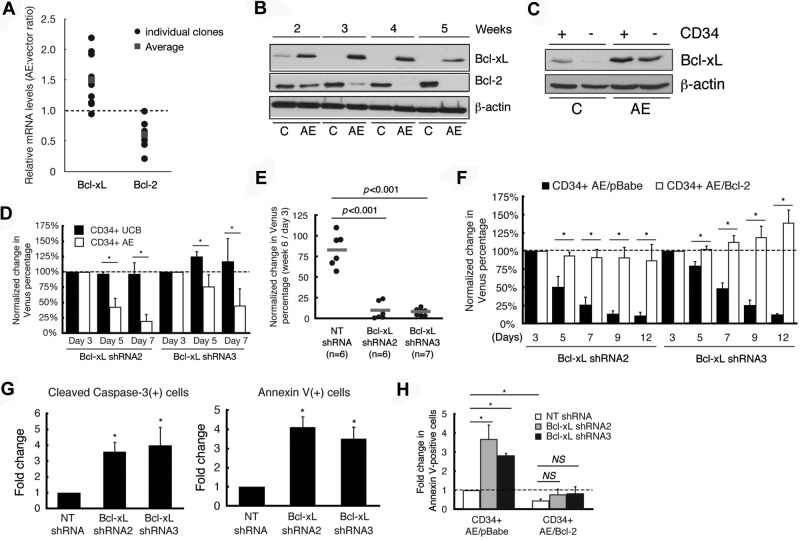
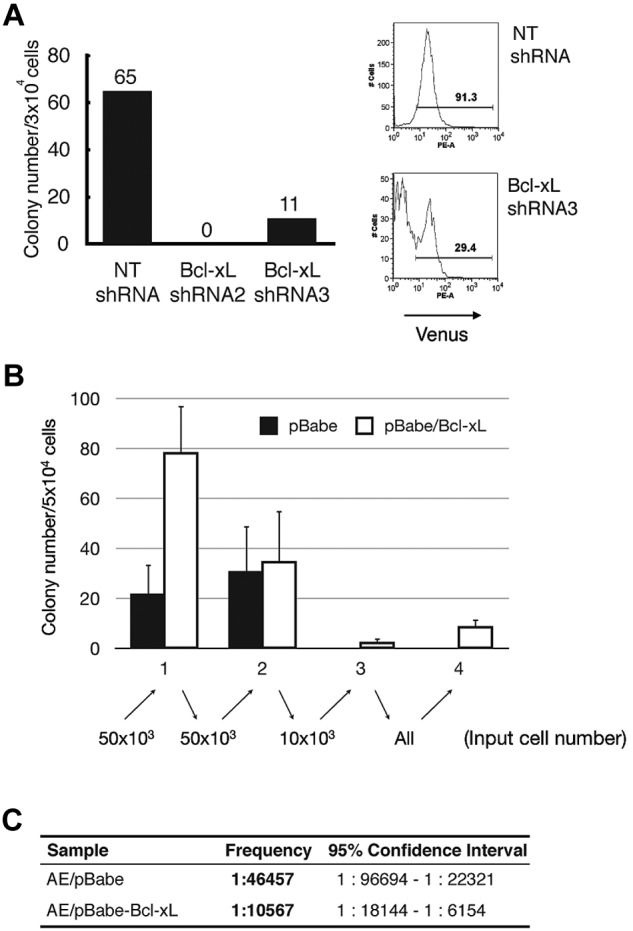
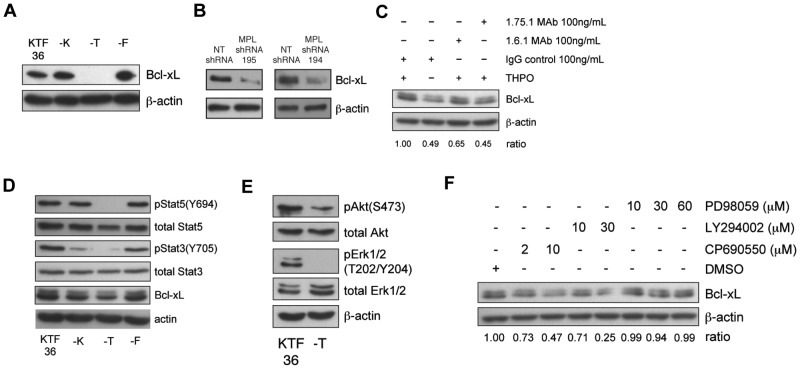
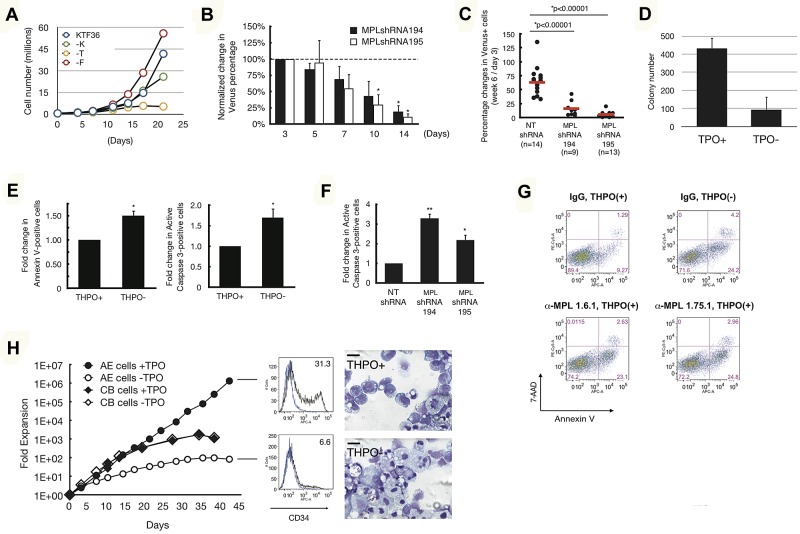
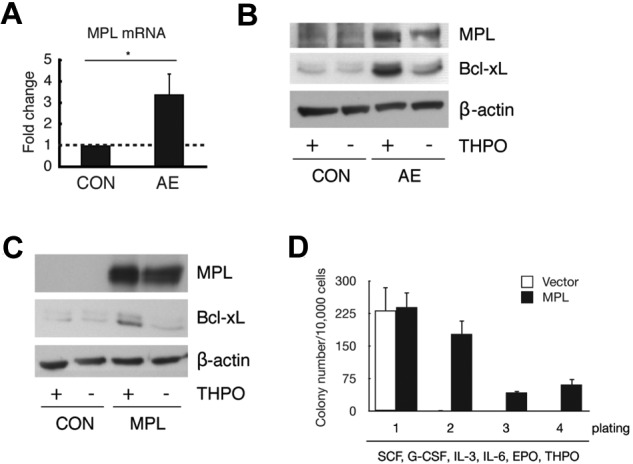
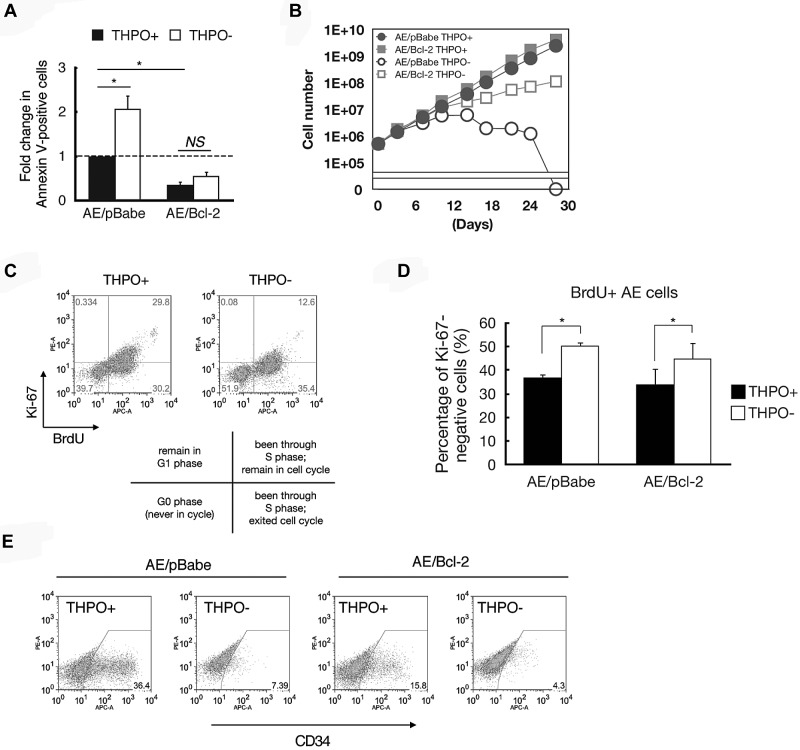
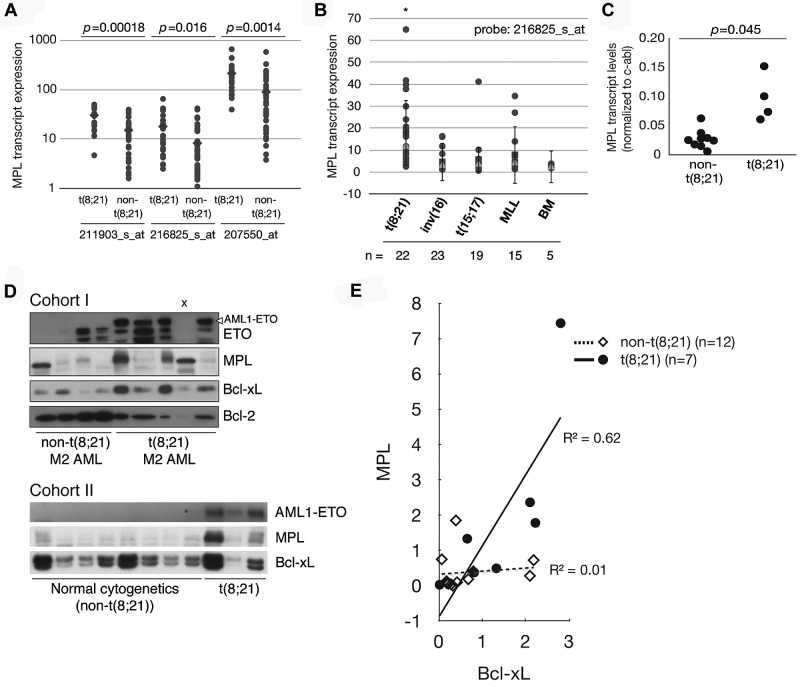
AML1-ETO (AE) is a fusion product of translocation (8;21) that accounts for 40% of M2 type acute myeloid leukemia (AML). In addition to its role in promoting preleukemic hematopoietic cell self-renewal, AE represses DNA repair genes, which leads to DNA damage and increased mutation frequency. Although this latter function may promote leukemogenesis, concurrent p53 activation also leads to an increased baseline apoptotic rate. It is unclear how AE expression is able to counterbalance this intrinsic apoptotic conditioning by p53 to promote survival and self-renewal. In this report, we show that Bcl-xL is up-regulated in AE cells and plays an essential role in their survival and self-renewal. Further investigation revealed that Bcl-xL expression is regulated by thrombopoietin (THPO)/MPL-signaling induced by AE expression. THPO/MPL-signaling also controls cell cycle reentry and mediates AE-induced self-renewal. Analysis of primary AML patient samples revealed a correlation between MPL and Bcl-xL expression specifically in t(8;21) blasts. Taken together, we propose that survival signaling through Bcl-xL is a critical and intrinsic component of a broader self-renewal signaling pathway downstream of AML1-ETO-induced MPL.


Figures

Figure 1
Figure 1
Bcl-xL is up-regulated in association with AE expression and is critical for the survival of AE cells. (A) CD34+ UCB cells were transduced with vector- or AE-expressing retroviruses, followed by lysis for RNA extraction and quantitative PCR for Bcl-xL and Bcl-2. c-abl gene expression was used for normalization. (B) CD34+ UCB cells were transduced with vector (C) or AE-expressing retrovirus, followed by lysis for protein extraction and immunoblotting at indicated time points. (C) CD34+ and CD34 AE cells were separated using magnetic beads, followed by lysis for protein extraction and Western blotting. (D) CD34+ UCB or AE cells were transduced with NT shRNA, Bcl-xL shRNA2, or Bcl-xL shRNA3. The percentage of transduced AE cells was determined by flow cytometry at days 3, 5, and 7. The percentages at days 5 and 7 were normalized to day 3 within each group, followed by normalizing each time point in the Bcl-xL shRNA2 and Bcl-xL shRNA3 groups to the NT shRNA group. Data represents mean ± standard deviation (SD; n = 4;*P < .05). (E) Scatter plots showing percent change in Venus(+) cells at week 6 compared with initial transduction efficiency at day 3. Total BM cells were obtained by flushing the injected bone with PBS using a 28-G needle, followed by red blood cell lysis and labeling of the remaining cells with antibody against human CD45 surface antigen for flow cytometry analysis. Each dot represents 1 mouse. Bars indicate mean. (F) CD34+ AE/pBabe or AE/Bcl-2 cells were transduced with NT shRNA, Bcl-xL shRNA2, or Bcl-xL shRNA3. The percentage of transduced AE cells was determined by flow cytometry at indicated time points, followed by normalization as described in panel D. Data represents mean ± SD (n = 5; *P < .05). (G) Left: shRNA-transduced AE cells were fixed and permeabilized at day 3, followed by intracellular labeling with antibody against active caspase 3 for flow cytometry analysis. Right: shRNA-transduced AE cells were labeled with annexin-V and 7-AAD at day 3 for flow cytometry analysis. Data represents Mean ± SD (n = 3; *P < .05). (H) CD34+ AE/pBabe or AE/Bcl-2 cells were transduced with NT shRNA, Bcl-xL shRNA2, or Bcl-xL shRNA3. Transduced cells were sorted, followed by labeling with annexin V and 7-AAD for flow cytometry analysis. Data represents Mean ± SD (n = 3; *P < .05; NS indicates nonsignificant).
Figure 2
Figure 2
THPO/MPL/Bcl-xL signaling is critical for primitive AE cells. (A) shRNA-expressing lentivirus transduced AE cells were sorted at day 3, followed by plating in methylcellulose media. Colony numbers were scored after 14 days. Data shown indicates 1 representative experiment with initial seeding of 3 × 10⁴ cells. After colony counting, cells were collected and the percentage of transduced cells (Venus+ cells) was determined by flow cytometry. The experiment was repeated 3 additional times with consistent results. (B) CD34-selected cells were plated in methylcellulose media in the absence of THPO. Colony numbers were scored after 14 days under a light microscope. Cells were then collected and replated with indicated input cell numbers. One representative experiment is shown. Results were confirmed in 3 additional AE clones. Data represents mean ± SD (n = 3; *P < .05). (C) CD34-selected cells were cocultured with MS5 in 96-well plates at the densities of 3000, 10 000, and 30 000 cells per well in 10 replicates. After 5 weeks, methylcellulose media containing THPO was added to each well, which was then scored for the absence or presence of colonies after 14 days. L-Calc software was used to calculate LTC-IC frequency.
Figure 3
Figure 3
Loss of THPO/MPL signaling leads to Bcl-xL down-regulation in AE cells. (A) AE cells were washed with PBS 3 times, followed by culture with KTF36, TF36 (-K), KF36 (-T), or KT36 (-F) for 7 days. Proteins were then extracted for Western blotting. (B) AE cells transduced with indicated shRNA for 2 days were sorted and lysed for Western blotting. (C) AE cells were treated with indicated antibodies in the absence of THPO (but in the presence of KF36) for 1.5 hours, followed by adding THPO to the indicated groups for additional 24 hours. Cells were then lysed for Western blotting. (D-E) AE cells incubated with indicated cytokines for 24 hours were lysed for immunoblotting. (F) AE cells were treated with vehicle control (DMSO), a MEK inhibitor (PD98059), a PI3K inhibitor (LY294002) or a JAK2 inhibitor (CP690550) at indicated concentrations for 24 hours, followed by lysis for immunoblotting.
Figure 4
Figure 4
THPO/MPL signaling is essential for AE cells. (A) AE cells incubated with indicated cytokines were counted biweekly. One representative experiment was shown. The experiment was repeated 3 times using 2 AE clones with consistent results. (B) AE cells were transduced with NT shRNA, MPL shRNA194, or MPL shRNA195. The percentage of transduced AE cells were determined by flow cytometry at indicated time points, followed by normalization as described in Figure 1D. Data represent mean ± SD (n = 3; *P < .05) compared with day 3. (C) Scatter plots showing percentage change in Venus(+) cells at week 6 compared with initial transduction efficiency at day3. Total BM cells were obtained by flushing the injected bone with PBS using a 28-G needle, followed by red blood cell lysis and labeling of the remaining cells with antibody against human CD45 surface antigen for flow cytometry analysis. Each dot represents one mouse. Red bars indicate mean. (D) Cells were seeded in methylcellulose media containing KG36E (THPO−) or KG36ET (THPO+) at 5 × 10⁴ per dish in triplicate. Colony numbers were scored after 14 days under a light microscope. One representative experiment is shown. Results were confirmed with 3 additional AE clones. Data represents mean ± SD (n = 3). (E) AE cells incubated with KF36 ± THPO for 3 days were stained with annexin V (left), or permeabilized and stained for active caspase 3 (right), followed by flow cytometry analysis. (F) AE cells transduced with indicated shRNAs were permeabilized and stained for active caspase 3, followed by flow cytometry analysis. (G) AE cells treated with respective anti-MPL antibodies with protocols described for Figure 3C were stained with annexin V and 7-AAD for flow cytometry analysis. (H) CD34+ UCB cells with or without AE transduction were cultured in media in KF36 ± THPO. Cell counting was performed biweekly using a hemocytometer. Data shown represents 1 UCB and 1 AE clone. The curves representing UCB THPO+ and THPO groups overlap with each other. Consistent results were obtained from 3 additional UCB clones and 2 additional AE clones. At day 28, an aliquot of AE cells were labeled with anti-CD34 antibodies for flow cytometry analysis or were cytocentrifuged for Wright-Giemsa staining.
Figure 5
Figure 5
AE up-regulates MPL to promote Bcl-xL expression and self-renewal. (A) UCB cells were transduced with control vector (CON) or AE overnight, followed by recovering the cells in fresh growth media for 2 to 3 days, and lysis for RNA extraction. Quantitative PCR was then performed to detect MPL transcript levels. The c-abl transcript was used as normalizer. Data represents mean ± SD (n = 6; *P < .05). (B) UCB cells transduced with vector control (CON) or AE were sorted and cultured in the absence or presence of THPO for 48 hours, followed by lysis for immunoblotting of indicated proteins. (C) UCB cells transduced with vector or MPL-expressing retroviruses were sorted and cultured in the absence or presence of THPO for 48 hours, followed by lysis for immunoblotting of indicated proteins. (D) UCB cells transduced with vector or MPL-expressing retroviruses were sorted and plated in methylcellulose media. Number of colonies was scored at day 14. Cells were then collected for replating.
Figure 6
Figure 6
THPO/MPL signaling regulates cell cycle reentry and prevents AE cell differentiation. (A) CD34+ AE/pBabe or AE/Bcl-2 cells were incubated with (+) or without (−) THPO for 3 days, followed by stained with annexin V and analyzed by flow cytometry. (B) CD34+ AE/pBabe or AE/Bcl-2 cells were cultured with (+) or without (−) THPO. Cell counts were performed biweekly to obtain growth curves of the cells in each condition. (C-D) Cell cycle exit analysis. AE cells washed with PBS 3 times were incubated with or without THPO (in the presence of KF36) in media containing 10μM BrdU for 24 hours. BrdU incorporation and Ki-67 marking were determined by flow cytometry (*P < .05). (E) AE/pBabe and AE/Bcl-2 cells cultured with or without THPO (in the presence of KF36) for 14 days were labeled with anti-CD34 antibodies for flow cytometry analysis.
Figure 7
Figure 7
Increased MPL expression and a correlation between MPL and Bcl-xL expression specifically in t(8;21) primary leukemic blasts. (A-B) Scatter plots showing microarray data extracted from a publicly available database comparing MPL transcript levels in t(8;21) and non-t(8,21) M2 AML samples using 3 probe sets (A) and comparing blasts with the indicated cytogenetic abnormalities. (C) Leukemic blasts with t(8;21) or normal cytogenetics [non-t(8,21)] were lysed for RNA and quantitative PCR was performed for MPL. c-abl gene expression was used for normalization. (D) Immunoblotting was performed on equal number of peripheral blood mononuclear cells (cohort I) or BM mononuclear cells (cohort II) from leukemic patients for indicated proteins (*nonspecific band). x indicates and excluded sample. No AML1-ETO band is present in this t(8,21)+ sample, probably due to protein degradation. (E) Intensities of MPL and Bcl-xL blots were determined by densitometry and normalized to the medians from each cohort, followed by plotting normalized Bcl-xL value against MPL value for each sample. Trendlines and R-square (R2) values were generated for non-t(8,21) and t(8;21) groups using Apple Numbers Version 2009 software.

Comment in

  • JAKing up AML1-ETO.
    Crispino JD. Crispino JD. Blood. 2012 Jul 26;120(4):703-4. doi: 10.1182/blood-2012-05-413104. Blood. 2012. PMID: 22835885 No abstract available.

Similar articles

Cited by

References

    1. Look AT. Oncogenic transcription factors in the human acute leukemias. Science. 1997;278(5340):1059–1064. - PubMed
    1. Okuda T, Cai Z, Yang S, et al. Expression of a knocked-in AML1-ETO leukemia gene inhibits the establishment of normal definitive hematopoiesis and directly generates dysplastic hematopoietic progenitors. Blood. 1998;91(9):3134–3143. - PubMed
    1. Higuchi M, O'Brien D, Kumaravelu P, Lenny N, Yeoh EJ, Downing JR. Expression of a conditional AML1-ETO oncogene bypasses embryonic lethality and establishes a murine model of human t(8;21) acute myeloid leukemia. Cancer Cell. 2002;1(1):63–74. - PubMed
    1. de Guzman CG, Warren AJ, Zhang Z, et al. Hematopoietic stem cell expansion and distinct myeloid developmental abnormalities in a murine model of the AML1-ETO translocation. Mol Cell Biol. 2002;22(15):5506–5517. - PMC - PubMed
    1. Fenske TS, Pengue G, Mathews V, et al. Stem cell expression of the AML1/ETO fusion protein induces a myeloproliferative disorder in mice. Proc Natl Acad Sci U S A. 2004;101(42):15184–15189. - PMC - PubMed

Publication types

MeSH terms