. 2012 May;107(10):2649-59.
doi: 10.1152/jn.01202.2011. Epub 2012 Feb 15.

Dark-adapted response threshold of OFF ganglion cells is not set by OFF bipolar cells in the mouse retina

Affiliations

Dark-adapted response threshold of OFF ganglion cells is not set by OFF bipolar cells in the mouse retina

A Cyrus Arman et al. J Neurophysiol. 2012 May.

Abstract

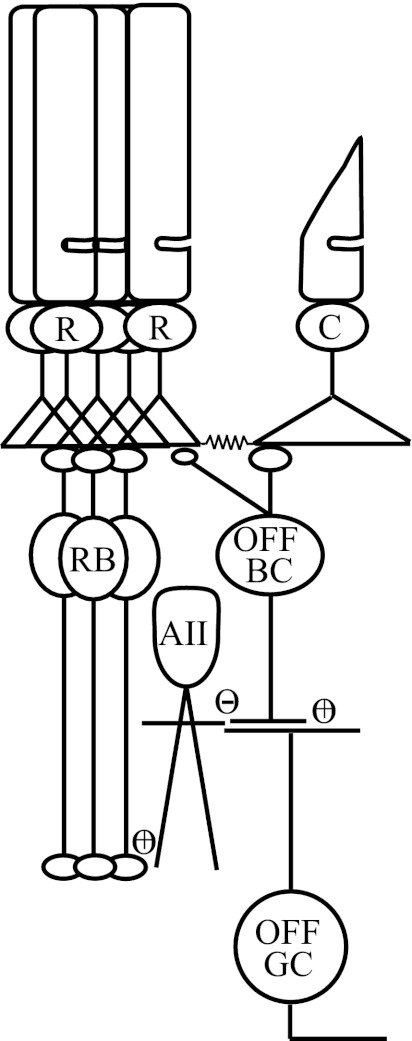
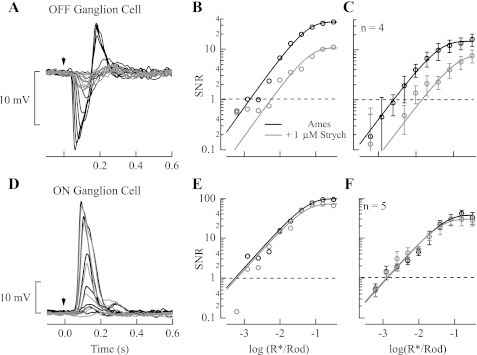
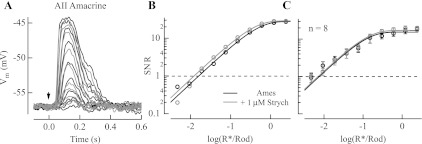
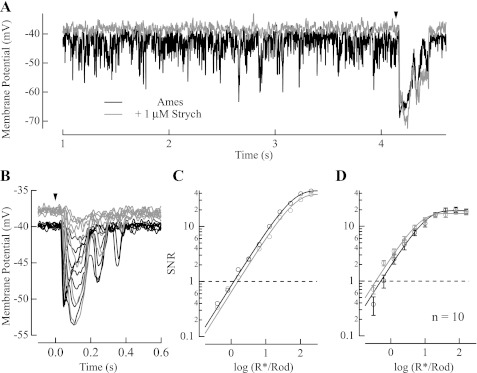
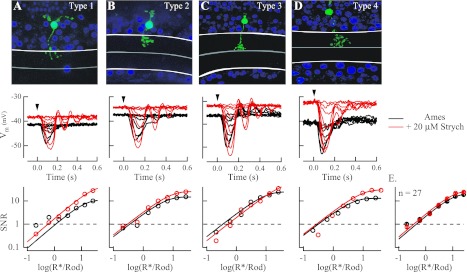
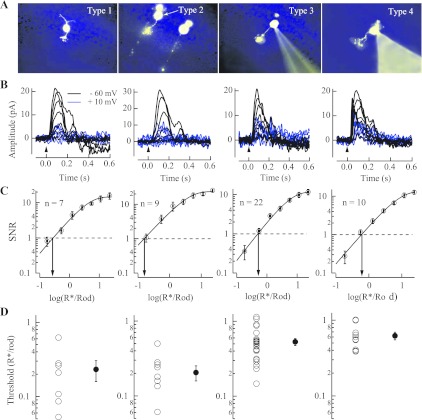
The nervous system frequently integrates parallel streams of information to encode a broad range of stimulus strengths. In mammalian retina it is generally believed that signals generated by rod and cone photoreceptors converge onto cone bipolar cells prior to reaching the retinal output, the ganglion cells. Near absolute visual threshold a specialized mammalian retinal circuit, the rod bipolar pathway, pools signals from many rods and converges on depolarizing (AII) amacrine cells. However, whether subsequent signal flow to OFF ganglion cells requires OFF cone bipolar cells near visual threshold remains unclear. Glycinergic synapses between AII amacrine cells and OFF cone bipolar cells are believed to relay subsequently rod-driven signals to OFF ganglion cells. However, AII amacrine cells also make glycinergic synapses directly with OFF ganglion cells. To determine the route for signal flow near visual threshold, we measured the effect of the glycine receptor antagonist strychnine on response threshold in fully dark-adapted retinal cells. As shown previously, we found that response threshold for OFF ganglion cells was elevated by strychnine. Surprisingly, strychnine did not elevate response threshold in any subclass of OFF cone bipolar cell. Instead, in every OFF cone bipolar subclass strychnine suppressed tonic glycinergic inhibition without altering response threshold. Consistent with this lack of influence of strychnine, we found that the dominant input to OFF cone bipolar cells in darkness was excitatory and the response threshold of the excitatory input varied by subclass. Thus, in the dark-adapted mouse retina, the high absolute sensitivity of OFF ganglion cells cannot be explained by signal transmission through OFF cone bipolar cells.


Figures

Fig. 1.
Fig. 1.
Rod pathways in the mouse retina: identified pathways by which rod (R)-generated signals can traverse the retinal circuitry en route to ganglion cells. In the rod bipolar pathway rods converge on rod ON bipolar cells (RB), which in turn provide glutamatergic input (+) to AII amacrine cells. AII amacrine cells make glycinergic inhibitory (−) synapses with both OFF ganglion cells (OFF GC) and OFF cone bipolar cells (OFF BC). OFF cone bipolar cells in turn relay glutamatergic (+) input to OFF ganglion cells. In the secondary rod pathways, OFF cone bipolar cells receive excitatory input from the cone photoreceptor (C) pedicles, or directly from rod spherules, depending on their subclass (see discussion).
Fig. 2.
Fig. 2.
Morphological characteristics, response properties of retinal cells, and behavioral threshold of Gnat2−/− mice. A: comparison of retinal morphology in wild-type (WT) and Gnat2−/− retinas. Epoxy resin sections (Chen et al. 2006) from 36-wk-old WT and Gnat2−/− retinas reveal no loss in retinal thickness or rod outer segment length. B: comparison of response properties in horizontal cells (HC), rod bipolar cells (RBC), OFF cone bipolar cells (OFF CB), and ON cone bipolar cells (ON CB) from dark-adapted WT and Gnat2−/− retinas. Representative flash families in current clamp were collected after the delivery of a 10-ms flash of light (arrowhead). Derived response characteristics are shown in Table 1, including the response threshold (see materials and methods), resting membrane potential, and time-to-peak of the dim flash responses for the number of cells shown next to the respective responses. We found no statistical difference in the response characteristics of any of these classes of cells between WT and Gnat2−/− mice. C: behavioral threshold was estimated in WT and Gnat2−/− mice based on their ability to escape from a water maze task (Okawa et al. 2010; Sampath et al. 2005). Briefly, mice were trained in room light to escape from a 6-walled water maze task, and we characterized the time they required to exit the maze as background light levels were progressively lowered to darkness. Behavioral data are plotted as time to find the escape platform vs. background light intensity. Data reflect the behavioral performance of 4 WT and 4 Gnat2−/− mice, both bred into a C57BL/6 background. Each data point reflects the average of trials collected from 4 mice over 3 days with 3 trials/day (i.e., 36 samples). Data at every background light intensity are plotted as means ± SE. Behavioral data were fit with a Hill equation whose inflection points were 0.0048 and 0.0053 φ·μm−2·s−1 for WT (solid line) and Gnat2−/− (dashed line) mice, respectively. These data indicate that behavioral thresholds in Gnat2−/− and WT mice were similar and occurred at light levels that rely on single-photon responses traversing the retinal circuitry.
Fig. 3.
Fig. 3.
Strychnine increased response threshold in OFF, but not ON, ganglion cells. A: current-clamp flash-response families from a dark-adapted Gnat2−/− OFF ganglion cell in the absence (black) and presence (gray) of 1 μM strychnine. Flashes were delivered at the time indicated by the downward arrow. B: signal-to-noise ratios (SNR) of flash responses vs. flash strength plotted on a log-log scale for the cell shown in A were fit with a saturating exponential function, and threshold was estimated where SNR = 1 (see materials and methods). C: collected data from 4 OFF ganglion cells indicate that response threshold shifted ∼4-fold in the presence of strychnine, from 0.0015 ± 0.00016 R*/Rod in Ames medium to 0.0062 ± 0.0013 R*/Rod in Ames medium with strychnine (P = 0.045). D: current-clamp flash response families from a dark-adapted Gnat2−/− ON ganglion cell in the absence (black) and presence (gray) of 1 μM strychnine. Flashes were delivered at the time indicated by the downward arrow for the same flash strengths as the OFF ganglion cell in A. E: SNR of flash responses plotted vs. flash strength for the cell shown in D were fit with a saturating exponential function, and threshold was estimated. F: collected data from 5 ON ganglion cells indicate that response threshold was unaffected by the presence of strychnine and was 0.0015 ± 0.00042 R*/Rod in Ames medium and 0.0012 ± 0.00026 R*/Rod in Ames medium with strychnine (P = 0.344).
Fig. 4.
Fig. 4.
Strychnine did not influence the response threshold for AII amacrine cells. A: current-clamp flash response families from a dark-adapted Gnat2−/− AII amacrine cell in the absence (black) and presence (gray) of 1 μM strychnine. Flashes were delivered at the time indicated by the downward arrow. B: SNR of flash responses plotted vs. flash strength for the cell shown in A were fit with a saturating exponential function from which response threshold was determined (see materials and methods). C: collected data from 8 AII amacrine cells indicate that response threshold was unaffected by the presence of strychnine and was 0.012 ± 0.002 R*/Rod in Ames medium and 0.015 ± 0.0022 R*/Rod in Ames medium with strychnine (P = 0.624).
Fig. 5.
Fig. 5.
Strychnine depolarized the resting membrane potential and suppressed spontaneous inhibitory noise in OFF cone bipolar cells. A: typical current-clamp recording from an OFF cone bipolar cell where the membrane potential was monitored in the absence (black) and presence (gray) of 1 μM strychnine in darkness and after a flash delivering ∼30 R*/Rod, whose timing is denoted by the downward arrowhead. B: current-clamp recordings of flash families in the absence (black) and presence (gray) of 1 μM strychnine. C: SNR plotted as a function of flash strength for the flash families in the absence (black) and presence (gray) of 1 μM strychnine as shown in B were fit with a saturating exponential function from which response threshold was determined (see materials and methods). D: average SNR plotted as a function of flash strength across 10 OFF cone bipolar cells, with response thresholds of 0.41 ± 0.082 R*/Rod in Ames medium and 0.38 ± 0.096 R*/Rod in Ames medium with strychnine (P = 0.578).
Fig. 6.
Fig. 6.
Strychnine did not influence response threshold in any of the 4 subclasses of OFF cone bipolar cells. A–D, top: type 1–4 OFF cone bipolar cells in Gnat2−/− retinas were identified on the basis of stratification of the axon terminal in the inner plexiform layer and the width of the dendritic arbor. White lines denote the limits of the inner plexiform layer, with the midpoint separating OFF from ON sublamina marked with a gray line. Middle: current-clamp recordings of flash families in the absence (black) and presence (red) of 20 μM strychnine for the photographed cells at top. Application of strychnine in all 27 OFF cone bipolar cells led to a depolarization of the cell's resting membrane potential (Vm), from −42.8 ± 1.3 mV in Ames medium to −37.6 ± 1.2 mV in Ames medium with strychnine (P = 0.0013). Bottom: SNR of flash responses plotted vs. flash strength for the cells shown at middle were fit with a saturating exponential function from which response threshold was determined (see materials and methods). E: collected data from 27 OFF cone bipolar cells across all subclasses indicate that despite the depolarization of the resting membrane potential response threshold was unaffected by the presence of strychnine and was 0.012 ± 0.002 R*/Rod in Ames medium and 0.015 ± 0.0022 R*/Rod in Ames medium with strychnine (P = 0.624).
Fig. 7.
Fig. 7.
Strychnine influenced response threshold only in OFF ganglion cells. Collected data from current-clamp recordings of OFF ganglion cells (OFFGC), AII amacrine cells (AIIAC), and OFF cone bipolar cells (OFFBC) (independent of subclasses) is shown on a cell-by-cell basis as the threshold in Ames medium plotted against the threshold in Ames medium with 1 μM strychnine and similar data collected from OFF cone bipolar cells in the absence and presence of 20 μM strychnine. A line with unity slope is included to compare changes in response threshold between recording conditions.
Fig. 8.
Fig. 8.
Input to OFF cone bipolar cells was mainly excitatory and varied in response threshold based on subclass. A: type 1–4 OFF cone bipolar cells in Gnat2−/− retinas were identified based on the stratification of the axon terminal in the inner plexiform layer and branching on the primary dendrite (see materials and methods). B: voltage-clamp flash families are shown for each subclass of OFF cone bipolar cell at Vm = −60 mV (black) and Vm = +10 mV (blue). C: average SNR of excitatory flash responses (Vm = −60 mV) plotted vs. flash strength for each subclass of OFF cone bipolar cell. Number of recorded cells in each subclass is also noted. D: response threshold for excitatory input, or flash strength where the SNR = 1 (see materials and methods), plotted on a log10 scale for each recorded cell (○) in each subclass of OFF cone bipolar cell. The average and SE response threshold (●) was 0.23 ± 0.073 R*/Rod for type 1 cells (n = 7), 0.21 ± 0.047 R*/Rod for type 2 cells (n = 9), 0.53 ± 0.057 R*/Rod for type 3 cells (n = 22), and 0.62 ± 0.07 R*/Rod for type 4 cells (n = 10). Note that response threshold was ∼3-fold higher in type 3 and 4 cells compared with type 1 and 2 cells, a significant difference (P = 0.00001).
Fig. 9.
Fig. 9.
Inhibitory input to OFF ganglion cells sets response threshold. A: light-evoked synaptic currents from 1 OFF ganglion cell. Top: raster plot generated from an on-cell recording of action potentials generated in response to a step of light that delivered ∼32 R*·rod−1·s−1 in 4 subsequent trials. After the whole cell recording was established in this cell, inhibitory currents were isolated at +10 mV (middle) and excitatory currents were isolated at −60 mV (bottom) in Ames medium (black). Application of Ames medium with 1 μM strychnine (gray) reduced inhibitory currents but did not influence substantially the suppression of excitatory currents. B: maximum inhibitory and excitatory currents plotted for 5 OFF ganglion cells (based on cell body size, response characteristics, and susceptibility of the inhibitory input to strychnine, these are likely OFF sustained α-ganglion cells; Murphy and Rieke 2011) before and after application of 1 μM strychnine. A line connects currents associated with the same cell before and after the application of strychnine. Strychnine reduced the maximum inhibitory current on average by ∼2-fold (1.9 ± 0.27-fold, mean ± SE; n = 5) but did not influence the maximum excitatory current. C: voltage-clamp recordings of light-evoked responses to a flash from an OFF ganglion cell (Vm = + 10 mV) in the absence (black) and presence (gray) of 1 μM strychnine. D: collected data from 5 OFF ganglion cells (Vm = +10 mV) indicates that response threshold shifted ∼6-fold in the presence of 1 μM strychnine, from 0.0013 ± 0.00027 R*/Rod in Ames medium to 0.0081 ± 0.0024 R*/Rod in Ames medium with strychnine (P = 0.041).

Similar articles

Cited by

References

    1. Bloomfield SA, Dacheux RF. Rod vision: pathways and processing in the mammalian retina. Prog Retin Eye Res 20: 351–384, 2001 - PubMed
    1. Bolz J, Thier P, Voigt T, Wässle H. Action and localization of glycine and taurine in the cat retina. J Physiol 362: 395–413, 1985 - PMC - PubMed
    1. Breuninger T, Puller C, Haverkamp S, Euler T. Chromatic bipolar cell pathways in the mouse retina. J Neurosci 31: 6504–6517, 2011 - PMC - PubMed
    1. Cao Y, Song H, Okawa H, Sampath AP, Sokolov M, Martemyanov KA. Targeting of RGS7/Gbeta5 to the dendritic tips of ON-bipolar cells is independent of its association with membrane anchor R7BP. J Neurosci 28: 10443–10449, 2008 - PMC - PubMed
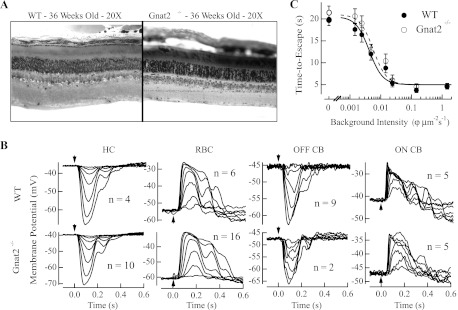
    1. Chang B, Dacey MS, Hawes NL, Hitchcock PF, Milam AH, Atmaca-Sonmez P, Nusinowitz S, Heckenlively JR. Cone photoreceptor function loss-3, a novel mouse model of achromatopsia due to a mutation in Gnat2. Invest Ophthalmol Vis Sci 47: 5017–5021, 2006 - PubMed

Publication types

MeSH terms