. 2012 Jun 1;302(11):E1352-62.
doi: 10.1152/ajpendo.00539.2011. Epub 2012 Feb 14.

Myocardial macronutrient transporter adaptations in the adult pregestational female intrauterine and postnatal growth-restricted offspring

Affiliations

Myocardial macronutrient transporter adaptations in the adult pregestational female intrauterine and postnatal growth-restricted offspring

Afshan Abbasi et al. Am J Physiol Endocrinol Metab. .

Abstract

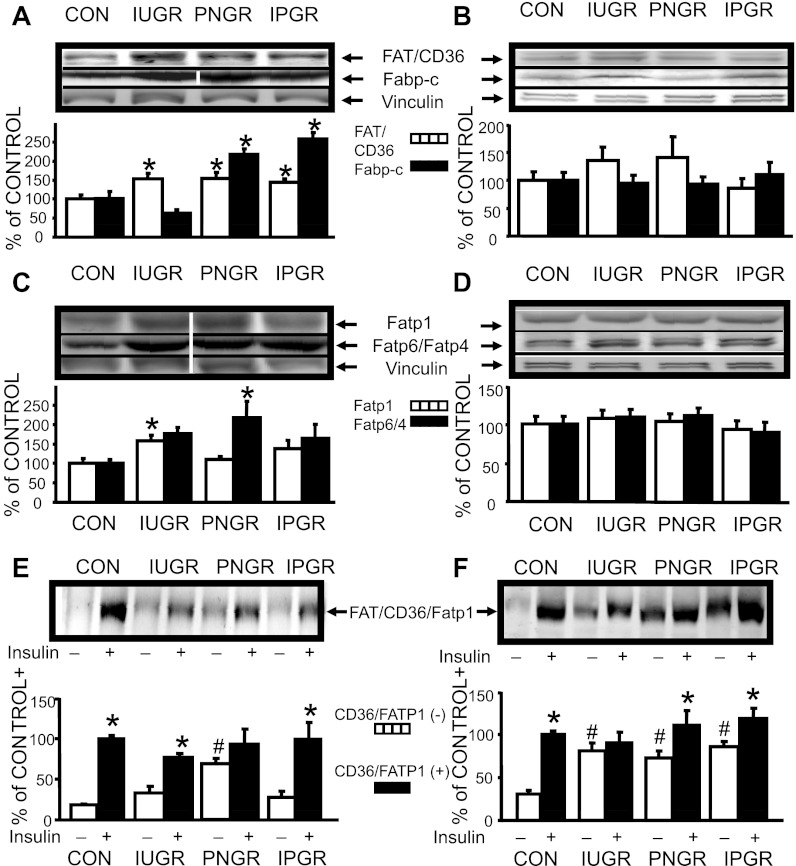
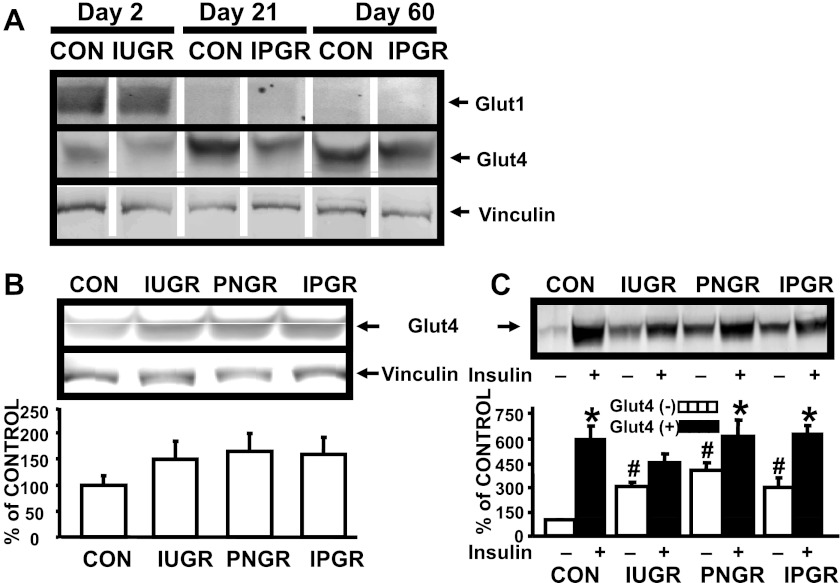
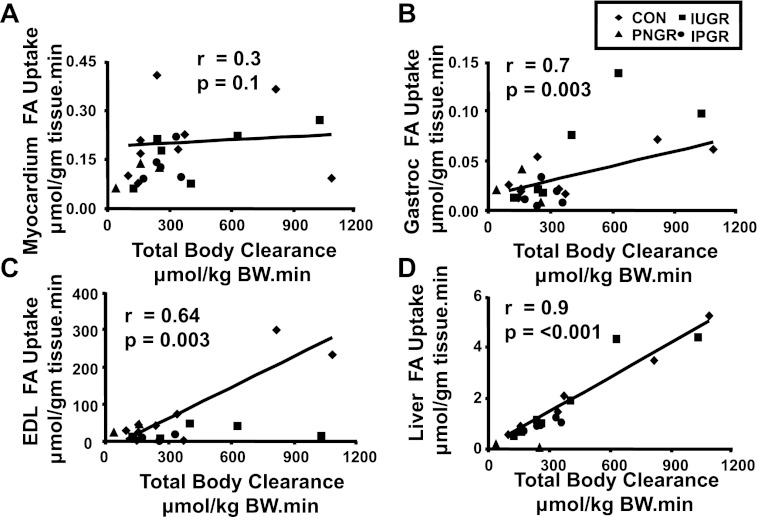
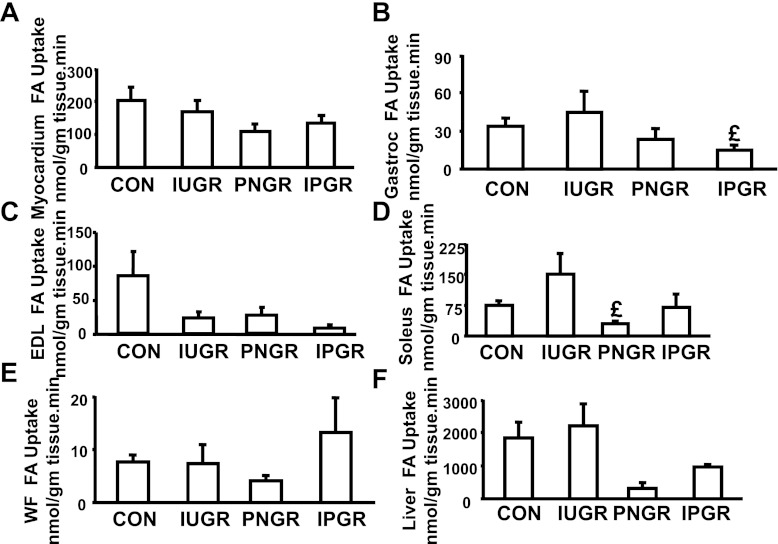
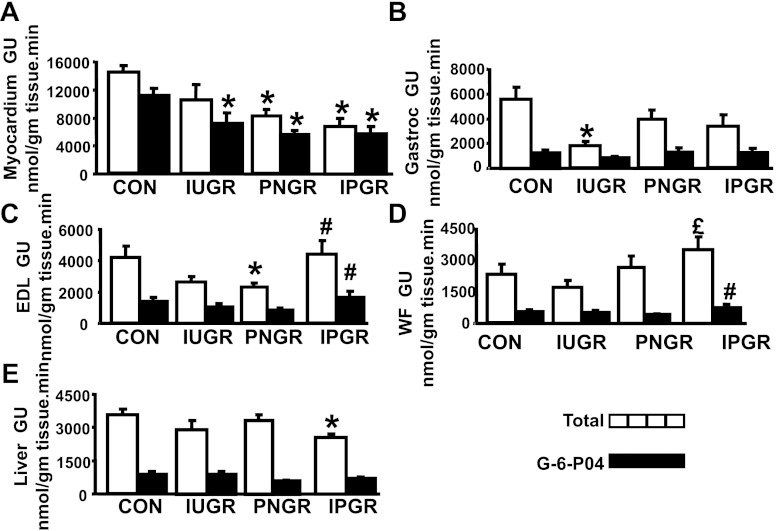
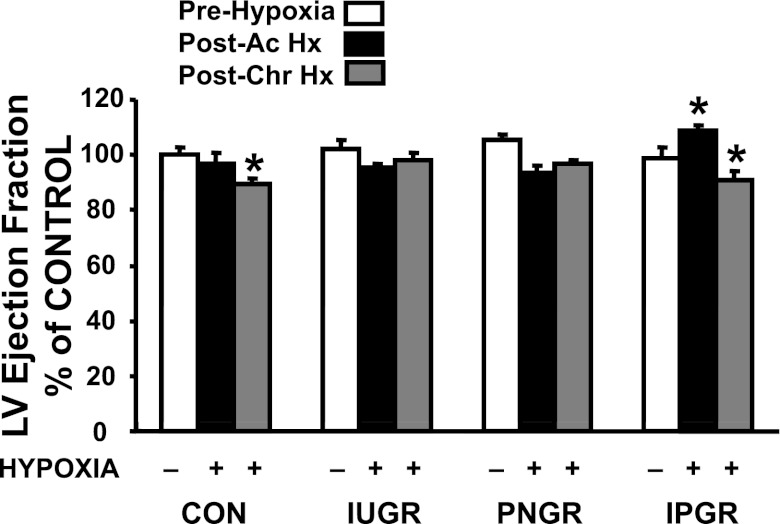
Associations between exponential childhood growth superimposed on low birth weight and adult onset cardiovascular disease with glucose intolerance/type 2 diabetes mellitus exist in epidemiological investigations. To determine the metabolic adaptations that guard against myocardial failure on subsequent exposure to hypoxia, we compared with controls (CON), the effect of intrauterine (IUGR), postnatal (PNGR), and intrauterine and postnatal (IPGR) calorie and growth restriction (n = 6/group) on myocardial macronutrient transporter (fatty acid and glucose) -mediated uptake in pregestational young female adult rat offspring. A higher myocardial FAT/CD36 protein expression in IUGR, PNGR, and IPGR, with higher FATP1 in IUGR, FATP6 in PNGR, FABP-c in PNGR and IPGR, and no change in GLUT4 of all groups was observed. These adaptive macronutrient transporter protein changes were associated with no change in myocardial [(3)H]bromopalmitate accumulation but a diminution in 2-deoxy-[(14)C]glucose uptake. Examination of the sarcolemmal subfraction revealed higher basal concentrations of FAT/CD36 in PNGR and FATP1 and GLUT4 in IUGR, PNGR, and IPGR vs. CON. Exogenous insulin uniformly further enhanced sarcolemmal association of these macronutrient transporter proteins above that of basal, with the exception of insulin resistance of FATP1 and GLUT4 in IUGR and FAT/CD36 in PNGR. The basal sarcolemmal macronutrient transporter adaptations proved protective against subsequent chronic hypoxic exposure (7 days) only in IUGR and PNGR, with notable deterioration in IPGR and CON of the echocardiographic ejection fraction. We conclude that the IUGR and PNGR pregestational adult female offspring displayed a resistance to insulin-induced translocation of FATP1, GLUT4, or FAT/CD36 to the myocardial sarcolemma due to preexistent higher basal concentrations. This basal adaptation of myocardial macronutrient transporters ensured adequate fatty acid uptake, thereby proving protective against chronic hypoxia-induced myocardial compromise.


Figures

Fig. 1.
Fig. 1.
Myocardial and skeletal muscle fatty acid transporter proteins (FATP). A: myocardial FAT/CD36 and cytoplasmic fatty acid binding protein (FABP-c) proteins. Top: representative Western blots of FAT/CD36, FABP-c with vinculin (internal control) proteins. Samples from control (CON) and intrauterine growth restriced (IUGR) are from noncontiguous lanes from that of the postnatal growth-restricted (PNGR) and combined (IPGR) samples, as shown by white dividing line. Bottom: densitometric quantification of FAT/CD36-vinculin and FABP-c-vinculin protein concentrations expressed as %ON in all 4 experimental groups: CON (n = 6), IUGR (n = 6), PNGR (n = 6), and IPGR (n = 6) at day 60. Fisher's PLSD = *P < 0.05 vs. CON. B: skeletal muscle FAT/CD36 and FABP-c proteins: Top: representative Western blots of FAT/CD36, FABP-c, and vinculin (internal control) proteins. Bottom: densitometric quantification of FAT/CD36-vinculin and FABP-c-vinculin protein concentrations expressed as %CON in all 4 experimental groups: CON (FAT/CD36 n = 8; FABP-c n = 6), IUGR (n = 9, 6), PNGR (n = 9, 6), and IPGR (n = 9, 6) at day 60. C: myocardial FATP1 and FATP6 proteins. Top: representative Western blots of FATP1, FATP6, and vinculin (internal control) proteins. Samples from CON and IUGR are from noncontiguous lanes from that of PNGR and IPGR samples, as shown by white dividing lines. Bottom: densitometric quantification of FATP1-vinculin and FATP6-vinculin protein concentrations expressed as %CON in all 4 experimental groups: CON (n = 6), IUGR (n = 6), PNGR (n = 6), and IPGR (n = 6) at day 60. Fisher's PLSD = *P < 0.05 vs. CON. D: skeletal muscle FATP1 and FATP4 proteins: Top: representative Western blots of FATP1, FATP4, and vinculin (internal control) proteins. Bottom: densitometric quantification of FATP1-vinculin and FATP4-vinculin protein concentrations expressed as %CON in all 4 experimental groups: CON (n = 9), IUGR (n = 9), PNGR (n = 9), and IPGR (n = 9) at day 60. E: myocardium sarcolemmal FAT/CD36 protein. Top: representative Western blot of FAT/CD36 in the absence (−) and presence (+) of insulin stimulation in all 4 experimental groups. Bottom: densitometric quantification of FAT/CD36 protein concentrations in the absence (−) and presence (+) of insulin stimulation expressed as %CON (+) in CON (n = 6), IUGR (n = 6), PNGR (n = 6), and IPGR (n = 6) at day 60. Fisher's PLSD = *P < 0.05 vs (−), #P < 0.05 vs. CON (−). F: myocardium sarcolemmal FATP1 protein. Top: representative Western blot of FATP1 in the absence (−) and presence (+) of insulin stimulation in all 4 experimental groups. Bottom: densitometric quantification of FATP1 protein concentrations in the absence (−) and presence (+) of insulin stimulation expressed as %CON (+), in CON (n = 6), IUGR (n = 6), PNGR (n = 6), and IPGR (n = 6) at day 60. Fisher's PLSD = *P < 0.05 vs. (−), #P < 0.05 vs. CON (−).
Fig. 2.
Fig. 2.
Myocardial and skeletal muscle glucose transporter protein. A: age-specific myocardial GLUT1 and GLUT4 proteins. Representative western blots of GLUT1, GLUT4, and vinculin (internal control) proteins at day 2 (CON and IUGR) and at days 21 and 60 (CON and IPGR each). B: myocardial GLUT4 proteins. Top: representative Western blot of GLUT4 and vinculin (internal control) proteins. Bottom: densitometric quantification of GLUT4-vinculin protein concentrations expressed as %CON in all 4 experimental groups: CON (n = 6), IUGR (n = 6), PNGR (n = 6), and IPGR (n = 6). C: myocardium sarcolemmal GLUT4 protein. Top: representative Western blot of GLUT4 in the absence (−) and presence (+) of insulin stimulation in all 4 experimental groups. Bottom: densitometric quantification of GLUT4 protein concentrations in the absence (−) and presence (+) of insulin stimulation expressed as %CON in CON (n = 6), IUGR (n = 6), PNGR (n = 6), and IPGR (n = 6) at day 60. Fisher's PLSD = *P < 0.05 vs. (−), #P < 0.05 vs. control (CON) (−).
Fig. 3.
Fig. 3.
Association between tissue fatty acid (FA) uptake and total body FA clearance. A–F: linear regression demonstrating correlations between total body FA clearance (x-axis, expressed as μmol·kg body wt−1·min−1) and myocardial (A), gastrocnemius (B), extensor digitorum longus (EDL; C), and liver (D) FA uptake (y-axes, expressed as μmol·g tissue−1·min−1) in 4 experimental groups: CON (n = 9), IUGR (n = 6), PNGR (n = 3), and IPGR (n = 5) at day 85–100. r and P values are depicted in individual panels.
Fig. 4.
Fig. 4.
Basal tissue [3H]R-bromopalmitate FA uptake. A–F: basal [3H]R-bromopalmitate FA uptake expressed in nmol·g tissue−1·min−1 is depicted in myocardium (A), gastrocnemius (B), EDL (C), soleus (D), white fat (WF; E), and liver (F) at day 85–100 of all 4 experimental groups: CON (n = 9), IUGR (n = 6), PNGR (n = 3), and IPGR (n = 5). Fisher's PLSD = £P < 0.05 vs. IUGR.
Fig. 5.
Fig. 5.
Basal tissue 2-deoxy-[14C]glucose uptake. A–E: basal total deoxy-[14C]glucose uptake and [14C]glucose 6-phosphate content expressed in nmol·g tissue−1·min−1 is depicted in myocardium (A), gastrocnemius (B), EDL (C), WF (D), and liver (E) in all 4 experimental groups: CON (n = 6), IUGR (n = 6), PNGR (n = 6), and IPGR (n = 6) at day 60. Solid bars, total deoxy-[14C]glucose uptake (GU); stippled bars, phosphorylated deoxy-[14C]glucose content. Fisher's PLSD = *P < 0.05 vs. CON, £P < 0.05 vs. IUGR, #P < 0.05 vs. PNGR.
Fig. 6.
Fig. 6.
Echocardiographic assessment of myocardial performance under hypoxia. Left ventricular (LV) ejection fractions assessed by echocardiography are depicted at baseline under normoxia (prehypoxia), after 2 days of hypoxia (postacute; post-Ac Hx) and after 7 days of hypoxia (postchronic; post-Chr. Hx) and expressed as %prehypoxia baseline control in 4 experimental groups: CON (n = 6), IUGR (n = 6), PNGR (n = 6), and IPGR (n = 6) at day 60. Fisher's PLSD = *P < 0.05 vs. corresponding prehypoxia baseline value.

References

    1. Abel ED. Glucose transport in the heart. Front Biosci 9: 201–215, 2004 - PubMed
    1. Adair LS, Cole TJ. Rapid child growth raises blood pressure in adolescent boys who were thin at birth. Hypertension 41: 451–456, 2003 - PubMed
    1. Barker DJ. Fetal origins of cardiovascular disease. Ann Med 31, Suppl 1: 3–6, 1999 - PubMed
    1. Barker DJ, Osmond C, Forsen TJ, Kajantie E, Eriksson JG. Trajectories of growth among children who have coronary events as adults. N Engl J Med 353: 1802–1809, 2005 - PubMed
    1. Bers DM. Isolation and characterization of cardiac sarcolemma. Biochim Biophys Acta 555: 131–146, 1979 - PubMed

Publication types

MeSH terms