

Ginkgolide B inhibits renal cyst development in in vitro and in vivo cyst models
- PMID: 22338085
- PMCID: PMC3362062
- DOI: 10.1152/ajprenal.00356.2011
Ginkgolide B inhibits renal cyst development in in vitro and in vivo cyst models
Abstract
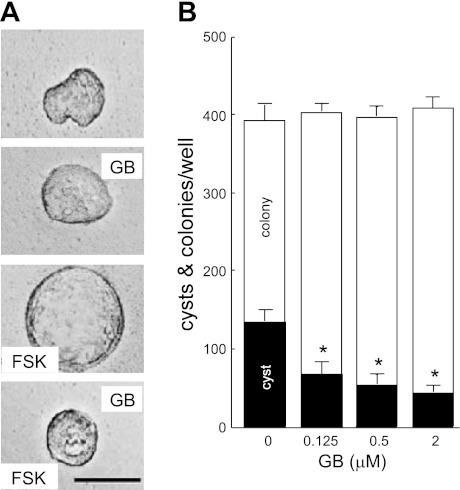
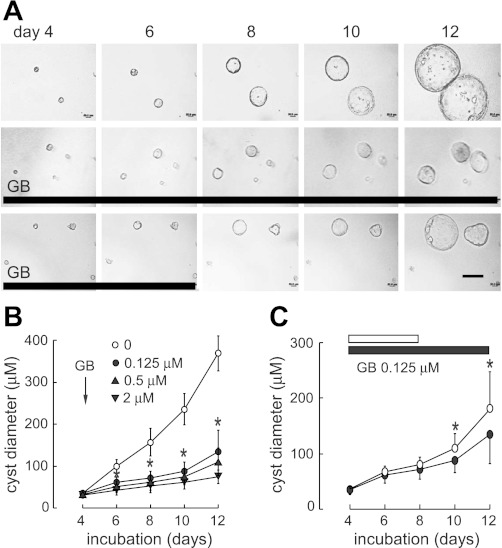
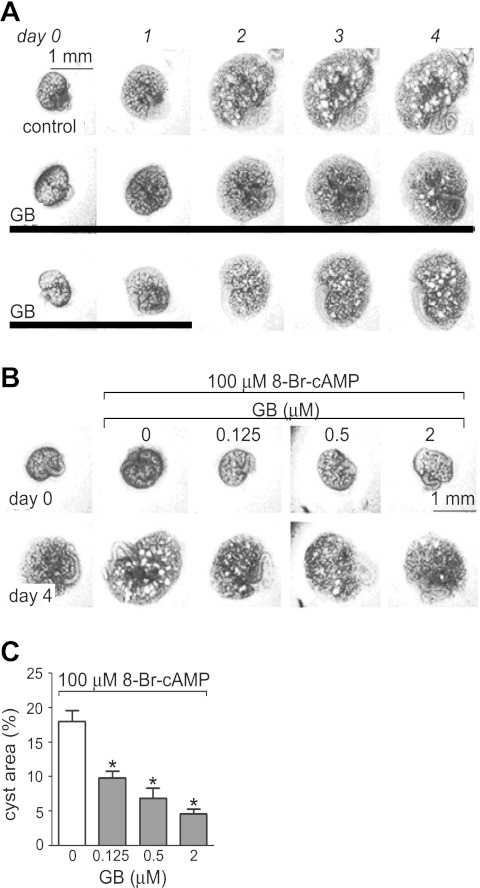
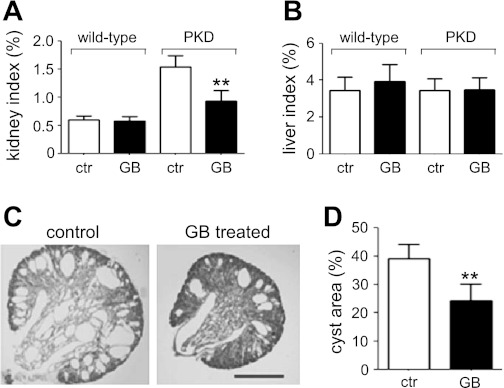
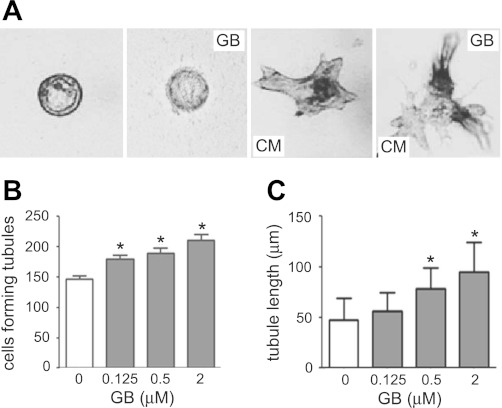
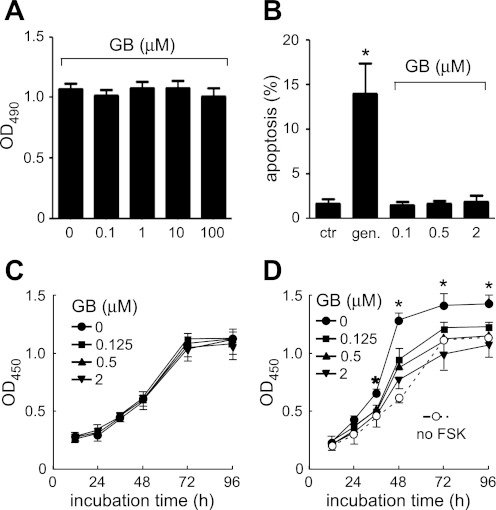
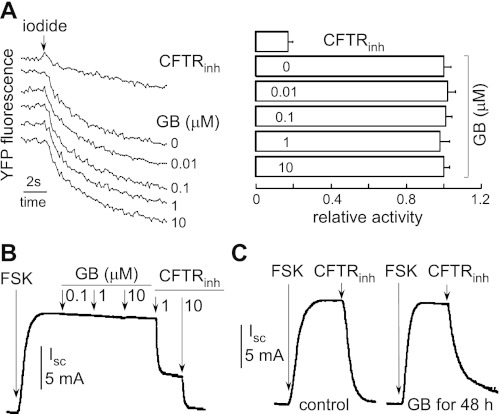
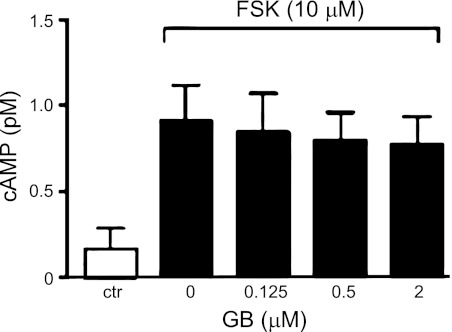
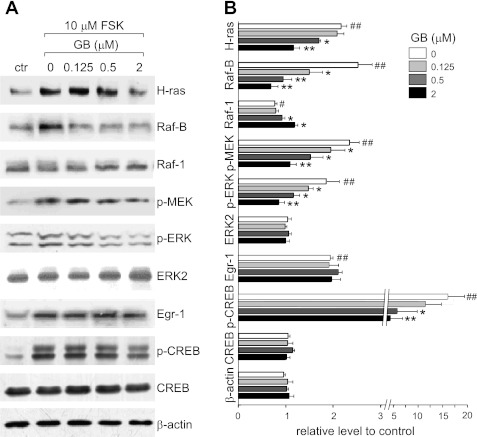
Autosomal dominant polycystic kidney disease (ADPKD) is a common inherited disease characterized by massive enlargement of fluid-filled cysts in the kidney. However, there is no effective therapy yet for this disease. To examine whether ginkgolide B, a natural compound, inhibits cyst development, a Madin-Darby canine kidney (MDCK) cyst model, an embryonic kidney cyst model, and a PKD mouse model were used. Interestingly, ginkgolide B significantly inhibited MDCK cyst formation dose dependently, with up to 69% reduction by 2 μM ginkgolide B. Ginkgolide B also significantly inhibited cyst enlargement in the MDCK cyst model, embryonic kidney cyst model, and PKD mouse model. To determine the underlying mechanisms, the effect of ginkgolide B on MDCK cell viability, proliferation, apoptosis, chloride transporter CFTR activity, and intracellular signaling pathways were also studied. Ginkgolide B did not affect cell viability, proliferation, and expression and activity of the chloride transporter CFTR that mediates cyst fluid secretion. Ginkgolide B induced cyst cell differentiation and altered the Ras/MAPK signaling pathway. Taken together, our results demonstrate that ginkgolide B inhibits renal cyst formation and enlargement, suggesting that ginkgolide B might be developed into a novel candidate drug for ADPKD.
Figures
Similar articles
-
Combination of curcumin and ginkgolide B inhibits cystogenesis by regulating multiple signaling pathways.Mol Med Rep. 2021 Mar;23(3):195. doi: 10.3892/mmr.2021.11834. Epub 2021 Jan 26. Mol Med Rep. 2021. PMID: 33495815 Free PMC article.
-
Quercetin inhibits renal cyst growth in vitro and via parenteral injection in a polycystic kidney disease mouse model.Food Funct. 2018 Jan 24;9(1):389-396. doi: 10.1039/c7fo01253e. Food Funct. 2018. PMID: 29215110
-
Cardamonin retards progression of autosomal dominant polycystic kidney disease via inhibiting renal cyst growth and interstitial fibrosis.Pharmacol Res. 2020 May;155:104751. doi: 10.1016/j.phrs.2020.104751. Epub 2020 Mar 6. Pharmacol Res. 2020. PMID: 32151678
-
[Inhibitors of intra-cystic secretion: novel therapies in ADPKD (Autosomal Dominant Polycystic Kidney Disease)].G Ital Nefrol. 2013 Jan-Feb;30(1):gin/30.1.2. G Ital Nefrol. 2013. PMID: 23832438 Review. Italian.
-
Nutraceutical for Autosomal Dominant Polycystic Kidney Disease Therapy.J Med Assoc Thai. 2016 Jan;99 Suppl 1:S97-103. J Med Assoc Thai. 2016. PMID: 26817244 Review.
Cited by
-
Potential Application of Gambogic Acid for Retarding Renal Cyst Progression in Polycystic Kidney Disease.Molecules. 2022 Jun 15;27(12):3837. doi: 10.3390/molecules27123837. Molecules. 2022. PMID: 35744960 Free PMC article.
-
New treatments for autosomal dominant polycystic kidney disease.Br J Clin Pharmacol. 2013 Oct;76(4):524-35. doi: 10.1111/bcp.12136. Br J Clin Pharmacol. 2013. PMID: 23594398 Free PMC article. Review.
-
Applications of Herbal Medicine to Treat Autosomal Dominant Polycystic Kidney Disease.Front Pharmacol. 2021 Apr 27;12:629848. doi: 10.3389/fphar.2021.629848. eCollection 2021. Front Pharmacol. 2021. PMID: 33986666 Free PMC article. Review.
-
Obacunone Retards Renal Cyst Development in Autosomal Dominant Polycystic Kidney Disease by Activating NRF2.Antioxidants (Basel). 2021 Dec 24;11(1):38. doi: 10.3390/antiox11010038. Antioxidants (Basel). 2021. PMID: 35052542 Free PMC article.
-
Targeting TRPM3 as a potential therapeutic approach for autosomal dominant polycystic kidney disease.Sci Rep. 2025 Feb 8;15(1):4714. doi: 10.1038/s41598-025-89200-z. Sci Rep. 2025. PMID: 39922884 Free PMC article.
References
-
- Battini L, Fedorova E, Macip S, Li X, Wilson PD, Gusella GL. Stable knockdown of polycystin-1 confers integrin-alpha2beta1-mediated anoikis resistance. J Am Soc Nephrol 17: 3049–3058, 2006 - PubMed
-
- Calvet JP. Strategies to inhibit cyst formation in ADPKD. Clin J Am Soc Nephrol 3: 1205–1211, 2008 - PubMed
-
- Calvet JP, Grantham JJ. The genetics and physiology of polycystic kidney disease. Semin Nephrol 21: 107–123, 2001 - PubMed
-
- Fisher CE, Michael L, Barnett MW, Davies JA. Erk MAP kinase regulates branching morphogenesis in the developing mouse kidney. Development 128: 4329–4338, 2001 - PubMed
Publication types
MeSH terms
Substances
LinkOut - more resources
Full Text Sources
Molecular Biology Databases