

Deep amino acid sequencing of native brain GABAA receptors using high-resolution mass spectrometry
- PMID: 22338125
- PMCID: PMC3270104
- DOI: 10.1074/mcp.M111.011445
Deep amino acid sequencing of native brain GABAA receptors using high-resolution mass spectrometry
Abstract
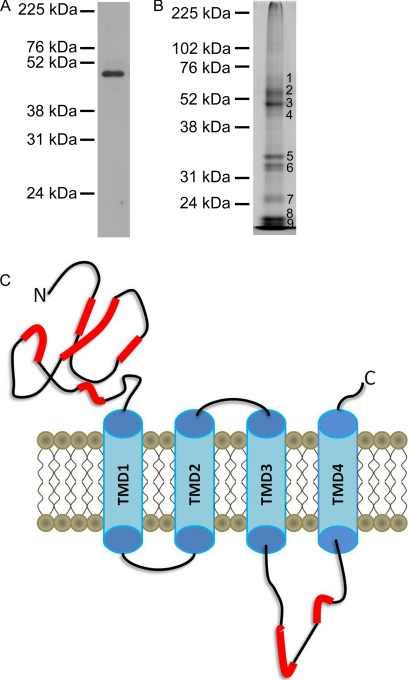
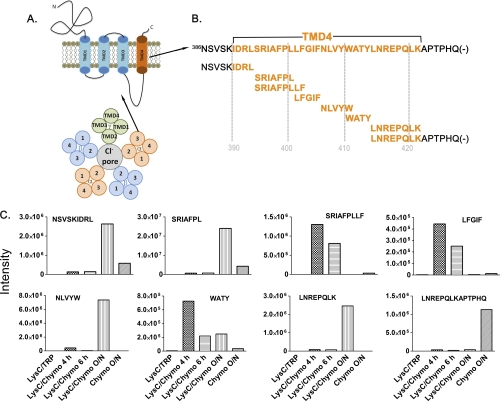
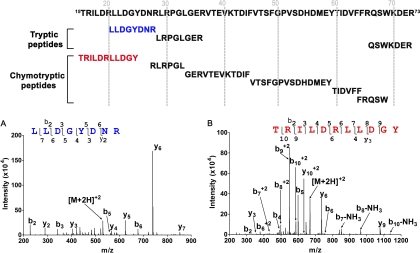
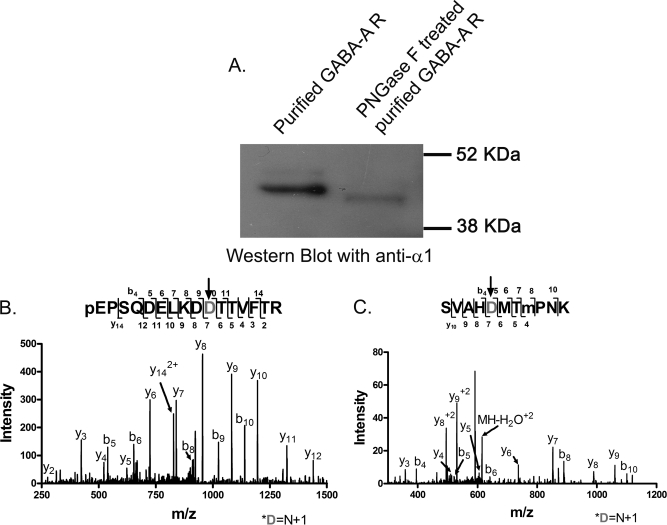
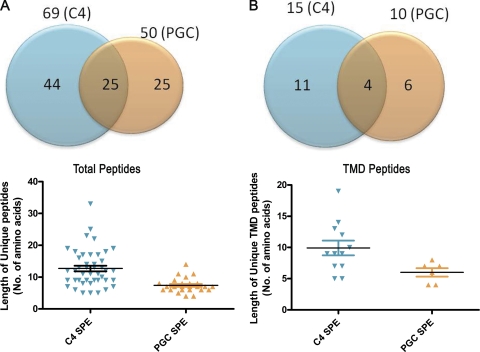
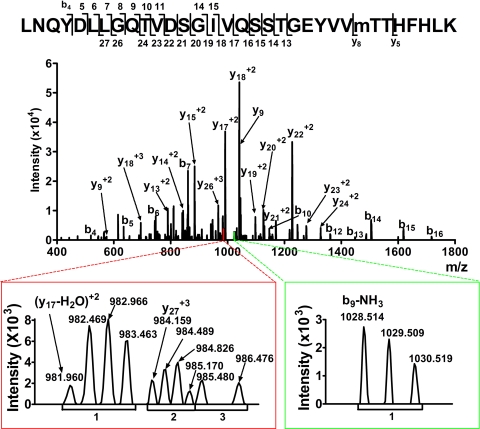
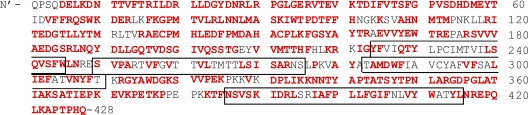
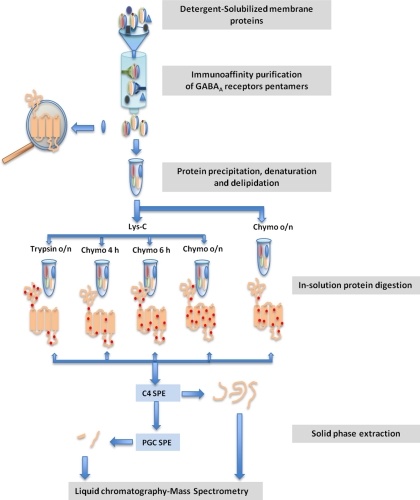
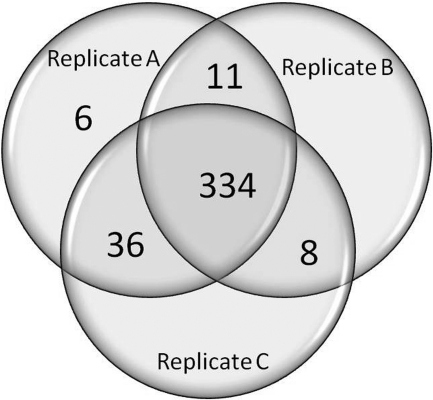
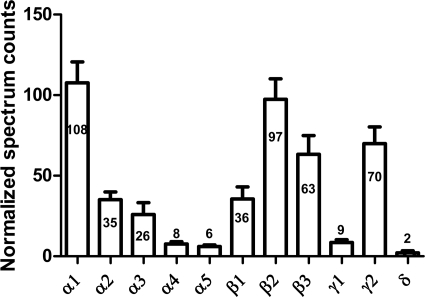
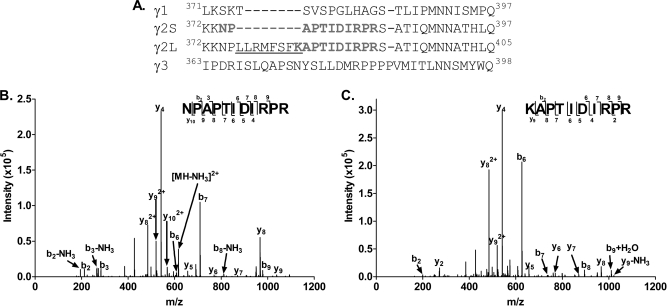
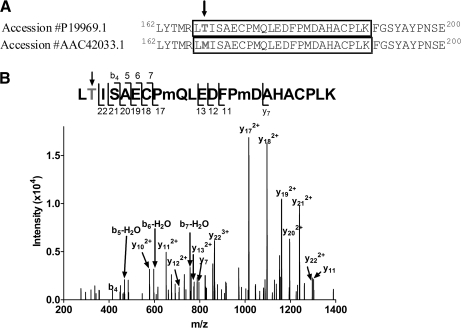
Mass spectrometric sequencing of low abundance, integral membrane proteins, particularly the transmembrane domains, presents challenges that span the multiple phases of sample preparation including solubilization, purification, enzymatic digestion, peptide extraction, and chromatographic separation. We describe a method through which we have obtained high peptide coverage for 12 γ-aminobutyric acid type A receptor (GABAA receptor) subunits from 2 picomoles of affinity-purified GABAA receptors from rat brain neocortex. Focusing on the α₁ subunit, we identified peptides covering 96% of the protein sequence from fragmentation spectra (MS2) using a database searching algorithm and deduced 80% of the amino acid residues in the protein from de novo sequencing of Orbitrap spectra. The workflow combined microscale membrane protein solubilization, protein delipidation, in-solution multi-enzyme digestion, multiple stationary phases for peptide extraction, and acquisition of high-resolution full scan and fragmentation spectra. For de novo sequencing of peptides containing the transmembrane domains, timed digestions with chymotrypsin were utilized to generate peptides with overlapping sequences that were then recovered by sequential solid phase extraction using a C4 followed by a porous graphitic carbon stationary phase. The specificity of peptide identifications and amino acid residue sequences was increased by high mass accuracy and charge state assignment to parent and fragment ions. Analysis of three separate brain samples demonstrated that 78% of the sequence of the α₁ subunit was observed in all three replicates with an additional 13% covered in two of the three replicates, indicating a high degree of sequence coverage reproducibility. Label-free quantitative analysis was applied to the three replicates to determine the relative abundances of 11 γ-aminobutyric acid type A receptor subunits. The deep sequence MS data also revealed two N-glycosylation sites on the α₁ subunit, confirmed two splice variants of the γ₂ subunit (γ₂L and γ₂S) and resolved a database discrepancy in the sequence of the α₅ subunit.
Figures
Similar articles
-
Complete sequencing of GABAA receptor subunit beta 3 by a rapid technique following in-gel digestion of the protein.Electrophoresis. 2009 Jun;30(12):2159-67. doi: 10.1002/elps.200900024. Electrophoresis. 2009. PMID: 19582715
-
Gel-based mass spectrometric analysis of a strongly hydrophobic GABAA-receptor subunit containing four transmembrane domains.Nat Protoc. 2009;4(7):1093-102. doi: 10.1038/nprot.2009.92. Epub 2009 Jul 2. Nat Protoc. 2009. PMID: 19707190
-
Comprehensive mass spectrometric analysis of the 20S proteasome complex.Methods Enzymol. 2005;405:187-236. doi: 10.1016/S0076-6879(05)05009-3. Methods Enzymol. 2005. PMID: 16413316 Review.
-
Lys-Sequencer: An algorithm for de novo sequencing of peptides by paired single residue transposed Lys-C and Lys-N digestion coupled with high-resolution mass spectrometry.Rapid Commun Mass Spectrom. 2020 Feb 15;34(3):e8574. doi: 10.1002/rcm.8574. Rapid Commun Mass Spectrom. 2020. PMID: 31499586
-
Current two-dimensional electrophoresis technology for proteomics.Proteomics. 2004 Dec;4(12):3665-85. doi: 10.1002/pmic.200401031. Proteomics. 2004. PMID: 15543535 Review.
Cited by
-
Photoaffinity labeling with cholesterol analogues precisely maps a cholesterol-binding site in voltage-dependent anion channel-1.J Biol Chem. 2017 Jun 2;292(22):9294-9304. doi: 10.1074/jbc.M116.773069. Epub 2017 Apr 10. J Biol Chem. 2017. PMID: 28396346 Free PMC article.
-
Endothelial Palmitoylation Cycling Coordinates Vessel Remodeling in Peripheral Artery Disease.Circ Res. 2020 Jul 3;127(2):249-265. doi: 10.1161/CIRCRESAHA.120.316752. Epub 2020 Apr 1. Circ Res. 2020. PMID: 32233916 Free PMC article.
-
Click Chemistry Reagent for Identification of Sites of Covalent Ligand Incorporation in Integral Membrane Proteins.Anal Chem. 2017 Feb 21;89(4):2636-2644. doi: 10.1021/acs.analchem.6b05003. Epub 2017 Feb 9. Anal Chem. 2017. PMID: 28194953 Free PMC article.
-
Interleukin-17 limits hypoxia-inducible factor 1α and development of hypoxic granulomas during tuberculosis.JCI Insight. 2017 Oct 5;2(19):e92973. doi: 10.1172/jci.insight.92973. JCI Insight. 2017. PMID: 28978810 Free PMC article.
-
Neuronal gamma-aminobutyric acid (GABA) type A receptors undergo cognate ligand chaperoning in the endoplasmic reticulum by endogenous GABA.Front Cell Neurosci. 2015 May 18;9:188. doi: 10.3389/fncel.2015.00188. eCollection 2015. Front Cell Neurosci. 2015. PMID: 26041994 Free PMC article.
References
-
- Choudhary C., Mann M. (2010) Decoding signalling networks by mass spectrometry-based proteomics. Nat. Rev. Mol. Cell Biol. 11, 427–439 - PubMed
-
- Speers A. E., Wu C. C. (2007) Proteomics of integral membrane proteins–theory and application. Chem. Rev. 107, 3687–3714 - PubMed
-
- Sprenger R. R., Jensen O. N. (2010) Proteomics and the dynamic plasma membrane: Quo Vadis? Proteomics 10, 3997–4011 - PubMed
Publication types
MeSH terms
Substances
Grants and funding
LinkOut - more resources
Full Text Sources
Other Literature Sources
Miscellaneous
