

The kinetic dose limit in room-temperature time-resolved macromolecular crystallography
- PMID: 22338689
- PMCID: PMC3284346
- DOI: 10.1107/S090904951105549X
The kinetic dose limit in room-temperature time-resolved macromolecular crystallography
Abstract
Protein X-ray structures are determined with ionizing radiation that damages the protein at high X-ray doses. As a result, diffraction patterns deteriorate with the increased absorbed dose. Several strategies such as sample freezing or scavenging of X-ray-generated free radicals are currently employed to minimize this damage. However, little is known about how the absorbed X-ray dose affects time-resolved Laue data collected at physiological temperatures where the protein is fully functional in the crystal, and how the kinetic analysis of such data depends on the absorbed dose. Here, direct evidence for the impact of radiation damage on the function of a protein is presented using time-resolved macromolecular crystallography. The effect of radiation damage on the kinetic analysis of time-resolved X-ray data is also explored.
Figures
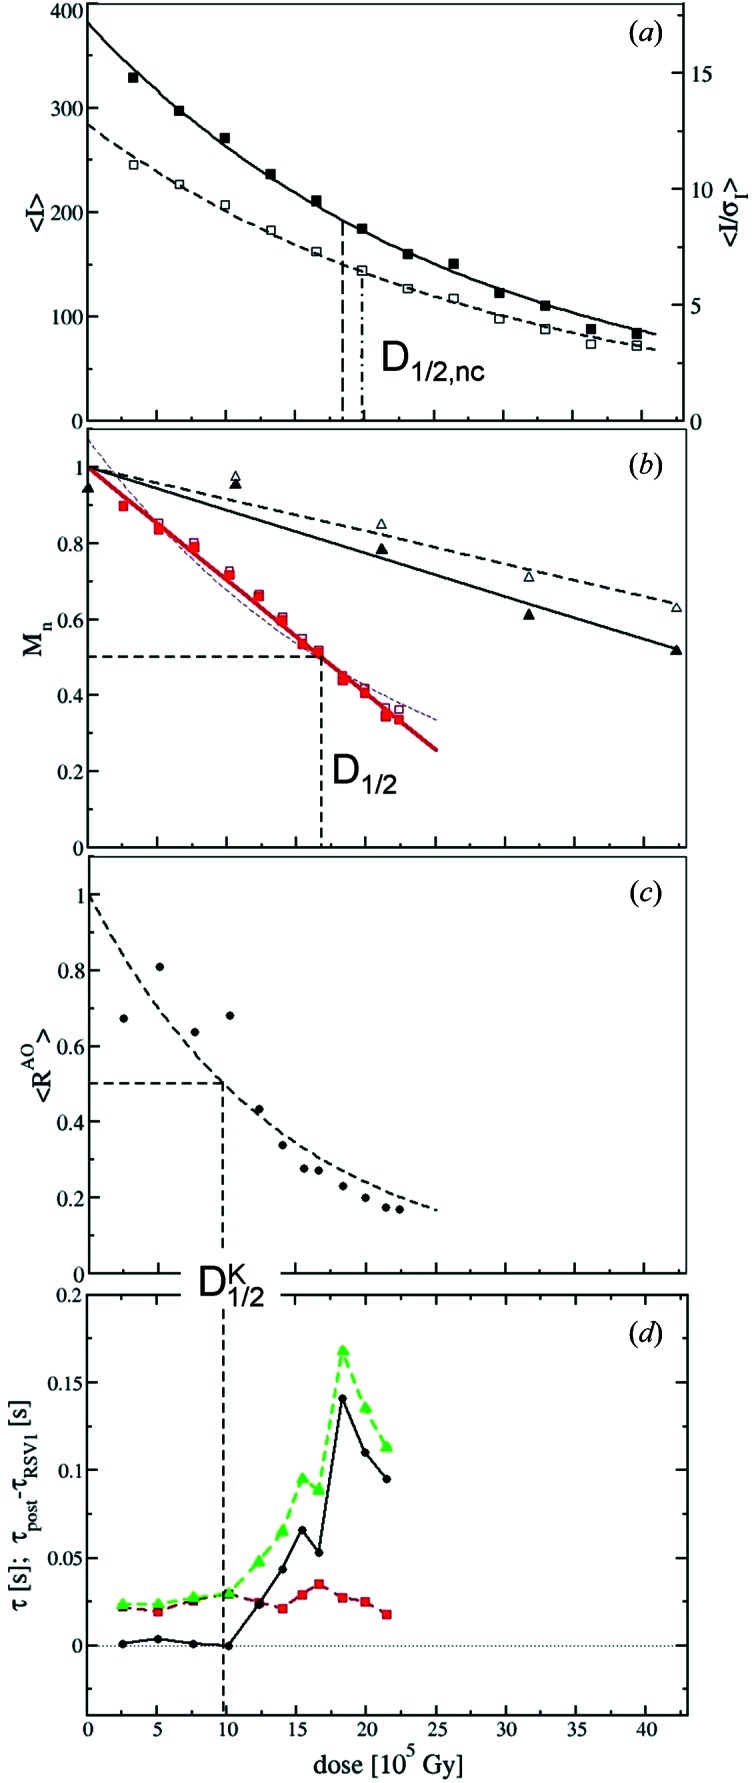
 and the corresponding kinetic dose limit
  . (d) Red squares: relaxation times τRSV1 from the SVD analysis as a function of adjusted dose. The red dashed line is a guide to the eye. Green triangles: inverse of the rate coefficient (relaxation time τpost) obtained from posterior analysis. The green dashed line is a guide to the eye. Black spheres: difference between τpost and τRSV1. The dashed vertical line indicates the kinetic dose limit .
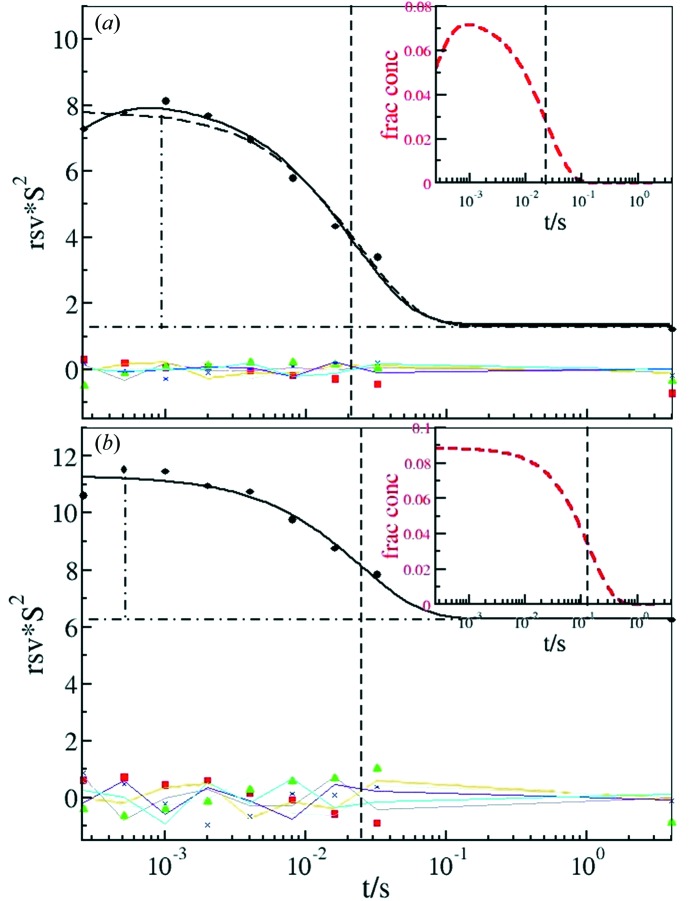
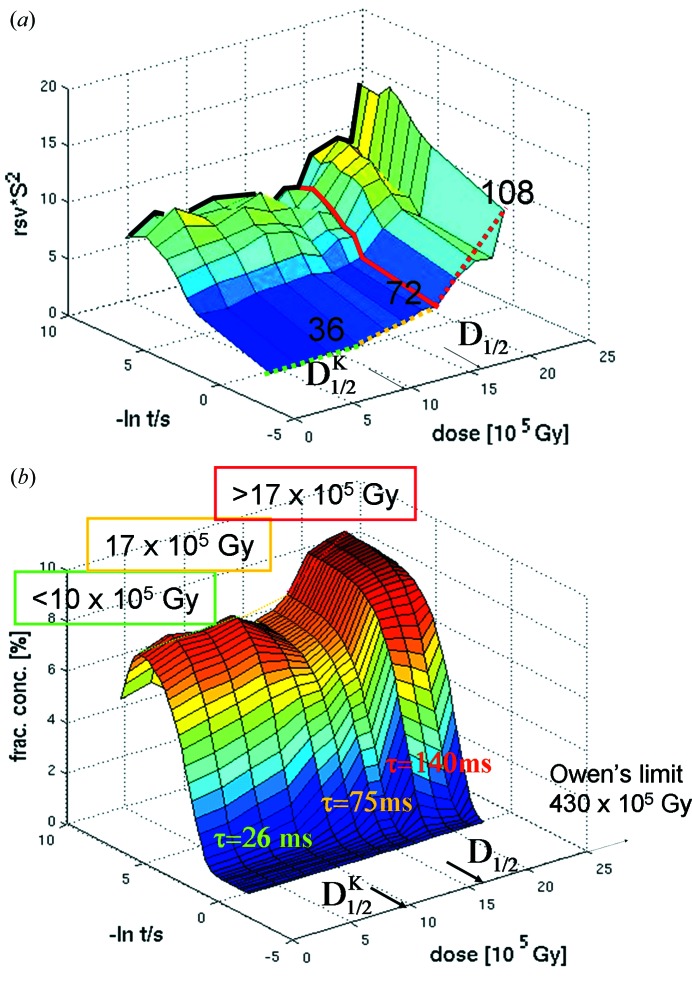 is reached after 36 datasets or four short time-series. The offsets in the RVS are indicated by the dotted lines. Green dotted line: small offsets; orange dotted line: offset increases slightly; red dotted line: offset increases strongly. The orange regime ends after 72 datasets. The red line indicates that posterior analysis of the data beyond this dose will not be possible. D
1/2 is also indicated. (b) Three-dimensional plot of all fitted time courses from the posterior analysis as a function of dose. The green, orange and red regimes as well as the approximate relaxation times that can be expected in these regimes are marked. , D
1/2 as well as Owen’s limit are also shown.
is reached after 36 datasets or four short time-series. The offsets in the RVS are indicated by the dotted lines. Green dotted line: small offsets; orange dotted line: offset increases slightly; red dotted line: offset increases strongly. The orange regime ends after 72 datasets. The red line indicates that posterior analysis of the data beyond this dose will not be possible. D
1/2 is also indicated. (b) Three-dimensional plot of all fitted time courses from the posterior analysis as a function of dose. The green, orange and red regimes as well as the approximate relaxation times that can be expected in these regimes are marked. , D
1/2 as well as Owen’s limit are also shown.References
-
- Adam, V., Royant, A., Nivière, V., Molina-Heredia, F. P. & Bourgeois, D. (2004). Structure, 12, 1729–1740. - PubMed
-
- Anderson, S., Srajer, V., Pahl, R., Rajagopal, S., Schotte, F., Anfinrud, P., Wulff, M. & Moffat, K. (2004). Structure, 12, 1039–1045. - PubMed
-
- Barker, A. I., Southworth-Davies, R. J., Paithankar, K. S., Carmichael, I. & Garman, E. F. (2009). J. Synchrotron Rad. 16, 205–216. - PubMed
-
- Berman, H. M., Battistuz, T., Bhat, T. N., Bluhm, W. F., Bourne, P. E., Burkhardt, K., Feng, Z., Gilliland, G. L., Iype, L., Jain, S., Fagan, P., Marvin, J., Padilla, D., Ravichandran, V., Schneider, B., Thanki, N., Weissig, H., Westbrook, J. D. & Zardecki, C. (2002). Acta Cryst. D58, 899–907. - PubMed
-
- Borgstahl, G. E., Williams, D. R. & Getzoff, E. D. (1995). Biochemistry, 34, 6278–6287. - PubMed
Publication types
MeSH terms
Substances
Grants and funding
LinkOut - more resources
Full Text Sources
Research Materials
