. 2012 Jan 18;102(2):296-304.
doi: 10.1016/j.bpj.2011.12.005.

Dynamical modeling of three-dimensional genome organization in interphase budding yeast

Affiliations

Dynamical modeling of three-dimensional genome organization in interphase budding yeast

Naoko Tokuda et al. Biophys J. .

Erratum in

  • Biophys J. 2012 Feb 8;102(3):719

Abstract

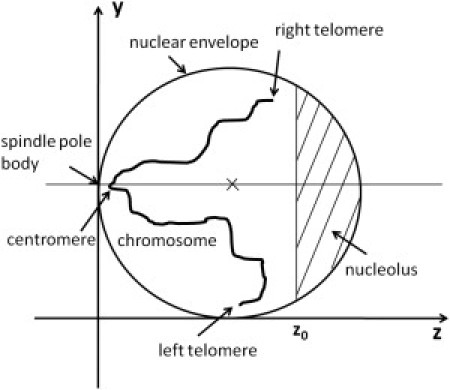
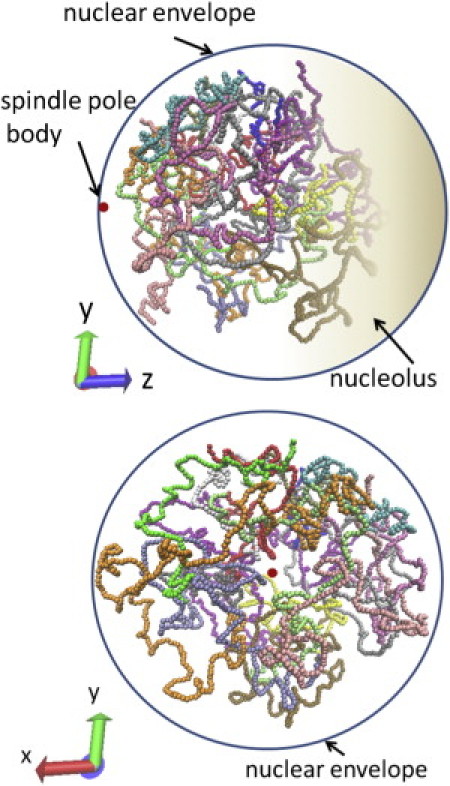
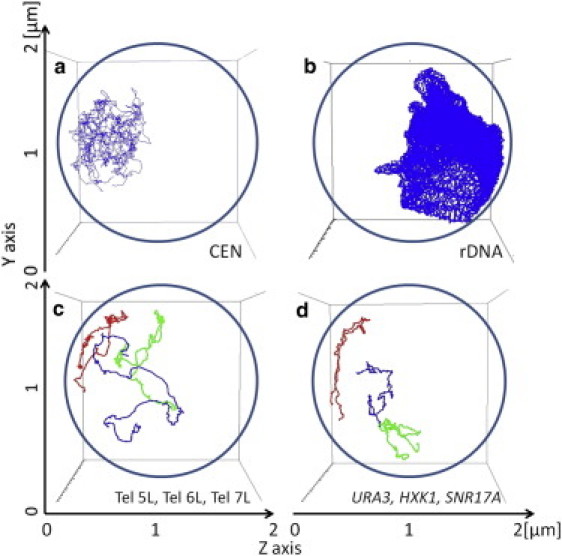
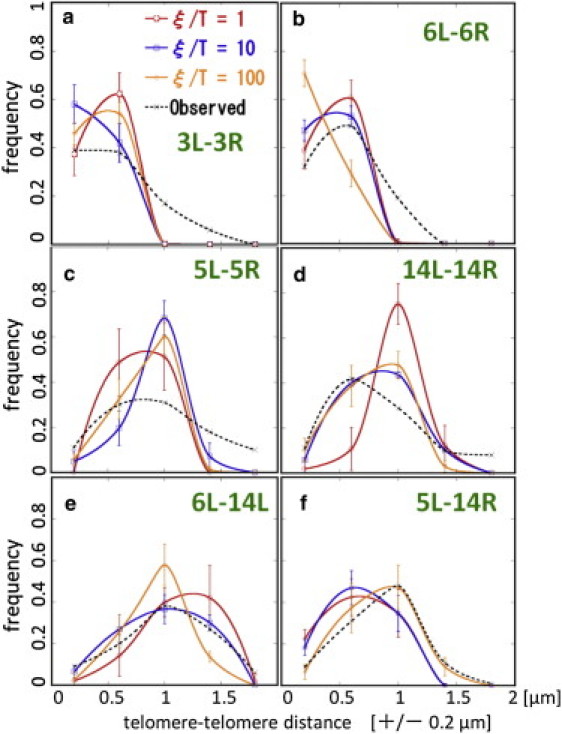
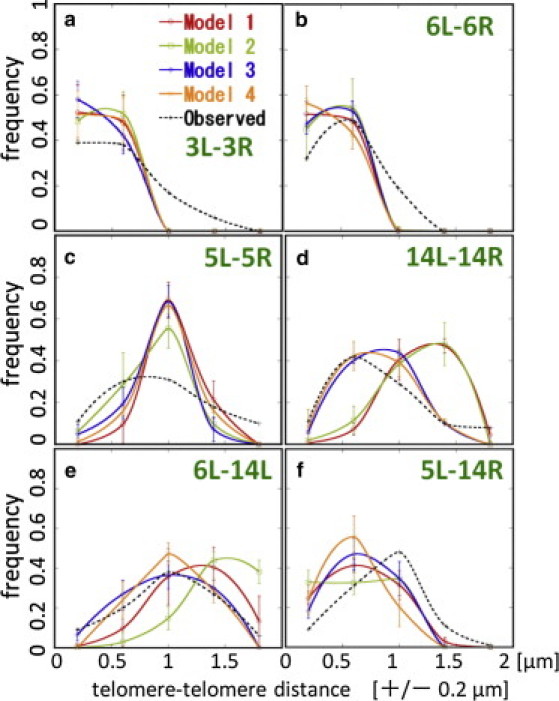
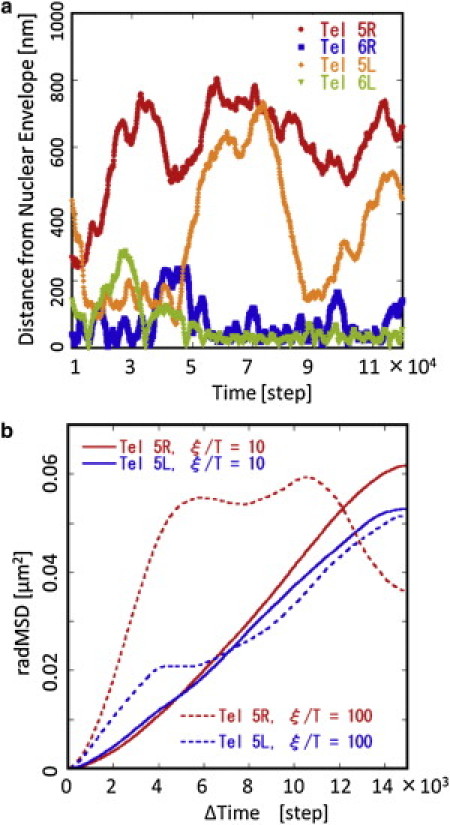
Eukaryotic genome is organized in a set of chromosomes each of which consists of a chain of DNA and associated proteins. Processes involving DNA such as transcription, duplication, and repair, therefore, should be intrinsically related to the three-dimensional organization of the genome. In this article, we develop a computational model of the three-dimensional organization of the haploid genome of interphase budding yeast by regarding chromosomes as chains moving under the constraints of nuclear structure and chromatin-chromatin interactions. The simulated genome structure largely fluctuates with the diffusive movement of chromosomes. This fluctuation, however, is not completely random, as parts of chromosomes distribute in characteristic ways to form "territories" in the nucleus. By suitably taking account of constraints arising from the data of the chromosome-conformation-capture measurement, the model explains the observed fluorescence data of chromosome distributions and motions.


Figures

Figure 1
Figure 1
Yeast nucleus is approximated by a sphere of radius 1 μm. Center of the sphere (marked by a cross) is at (1000,1000,1000) in units of nanometers in the model coordinate. Nucleolus is represented by the region of z > z0. One of 16 chromosomes (Chr10) is schematically drawn in the figure. Centromere of each chromosome is linked to spindle pole body (SPB), which is a protein complex embedded in the nuclear envelope, and termini of each chromosome are left and right telomeres.
Figure 2
Figure 2
Snapshot of the simulated genome structure. Structures of 16 chromosomes are shown by different colors; Chr1 (blue), Chr2 (red), Chr3 (gray), Chr4 (orange), Chr5 (yellow), Chr6 (tan), Chr7 (silver), Chr8 (green), Chr9 (white), Chr10 (pink), Chr11 (cyan), Chr12 (purple), Chr13 (lime), Chr14 (mauve), Chr15 (ochre), and Chr16 (ice-blue). (Red dot) SPB. The shaded region is nucleolus. (Top) Snapshot drawn from the angle similar to that in Fig. 1. (Bottom) Same structure viewed from the SPB side. Simulated with ξ/T = 10 and Model 3.
Figure 3
Figure 3
Examples of simulated trajectories of parts of the genome. (a) Trajectories of 16 centromeres are superposed. (b) Traces of the rDNA region moving during the simulation. (c) Trajectories of the left telomere of Chr5 (5L, blue); the left telomere of Chr6 (6L, red); and the left telomere of Chr7 (7L, green). (d) Trajectories of genes, ura3 (blue), hxk1 (red), and snr17a (green). The gene hxk1 is located near the telomere of Chr6, ura3 is near the centromere of Chr5, and snr17a is in between centromere and telomere of Chr15. Four spheres from panels ad are viewed from the same angle: (a) Centromeres move around SPB. (b) rDNA spreads inside the nucleolus. (c) 6L moves near the nuclear envelope, 5L is bound and unbound to and from the nuclear envelope, and 7L moves more freely. (d) Genes move separately to form gene “territories”. Trajectories of 1.1 × 105 steps simulated with ξ/T = 10 and Model 3 are shown.
Figure 4
Figure 4
Dependence of telomere-telomere distance distributions on the strength of chromatin-chromatin interactions. Data simulated with ξ/T = 1 (red), ξ/T = 10 (blue), and ξ/T = 100 (orange) are compared with the data observed with the fluorescently labeled proteins (black dotted line) (40). Distributions between (a) 3L and 3R, (b) 6L and 6R, (c) 5L and 5R, (d) 14L and 14R, (e) 6L and 14L, and (f) 5L and 14R. Points obtained by binning data over ±0.2 μm are connected (smooth lines). (Error bars) Standard deviations of trajectories simulated for 5 × 104 steps with Model 3.
Figure 5
Figure 5
Dependence of telomere-telomere distance distributions on the interactions between chromatins and the nuclear envelope. Data simulated with Model 1 (red), Model 2 (green), Model 3 (blue), and Model 4 (orange) are compared with the data observed with the fluorescently labeled proteins (black dotted line) (40). Distributions between (a) 3L and 3R, (b) 6L and 6R, (c) 5L and 5R, (d) 14L and 14R, (e) 6L and 14L, and (f) 5L and 14R. Points obtained by binning data over ±0.2 μm are connected (smooth lines). (Error bars) Standard deviations of trajectories simulated for 5 × 104 steps with ξ/T = 10.
Figure 6
Figure 6
Simulated telomere dynamics. (a) Temporal change of the simulated distance between telomeres and the nuclear envelope is shown for 5R, 5L, 6R, and 6L. Simulated with ξ/T = 10 and Model 3. (b) msdR(t) of 5R and 5L are plotted as functions of the number of time steps t. Simulated data for ξ/T = 10 (lines) and 100 (dotted lines) with Model 3 are shown for 5L (blue) and 5R (red). By comparing the slope of simulated msdR(t) with the observed one (13), it is suggested that 11 × 104 steps in simulation roughly correspond to 290–490 s (see text for this estimation).

References

    1. Misteli T. Beyond the sequence: cellular organization of genome function. Cell. 2007;128:787–800. - PubMed
    1. Miele A., Dekker J. Long-range chromosomal interactions and gene regulation. Mol. Biosyst. 2008;4:1046–1057. - PMC - PubMed
    1. Dillon N. The impact of gene location in the nucleus on transcriptional regulation. Dev. Cell. 2008;15:182–186. - PubMed
    1. Zimmer C., Fabre E. Principles of chromosomal organization: lessons from yeast. J. Cell Biol. 2011;192:723–733. - PMC - PubMed
    1. Lanctôt C., Cheutin T., et al. Cremer T. Dynamic genome architecture in the nuclear space: regulation of gene expression in three dimensions. Nat. Rev. Genet. 2007;8:104–115. - PubMed

Publication types

LinkOut - more resources