

Alterations in composition and diversity of the intestinal microbiota in patients with diarrhea-predominant irritable bowel syndrome
- PMID: 22339879
- PMCID: PMC3975596
- DOI: 10.1111/j.1365-2982.2012.01891.x
Alterations in composition and diversity of the intestinal microbiota in patients with diarrhea-predominant irritable bowel syndrome
Abstract
Background: The intestinal microbiota has been implicated in the pathophysiology of irritable bowel syndrome (IBS). Due to the variable resolutions of techniques used to characterize the intestinal microbiota, and the heterogeneity of IBS, the defined alterations of the IBS intestinal microbiota are inconsistent. We analyzed the composition of the intestinal microbiota in a defined subgroup of IBS patients (diarrhea-predominant IBS, D-IBS) using a technique that provides the deepest characterization available for complex microbial communities.
Methods: Fecal DNA was isolated from 23 D-IBS patients and 23 healthy controls (HC). Variable regions V1-V3 and V6 of the 16S rRNA gene were amplified from all samples. PCR products were sequenced using 454 high throughput sequencing. The composition, diversity and richness of microbial communities were determined and compared between D-IBS and HC using the quantitative insights into microbial ecology pipeline.
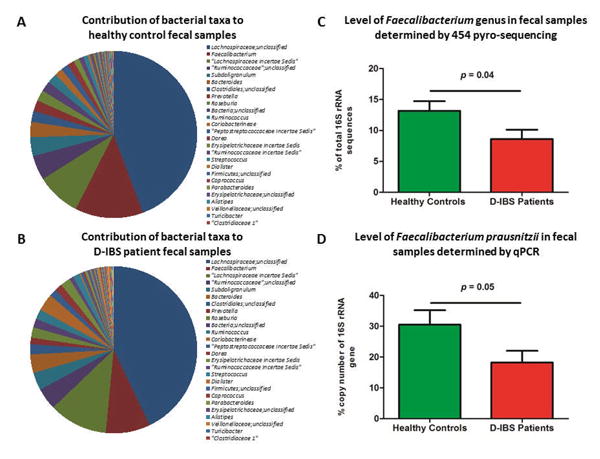
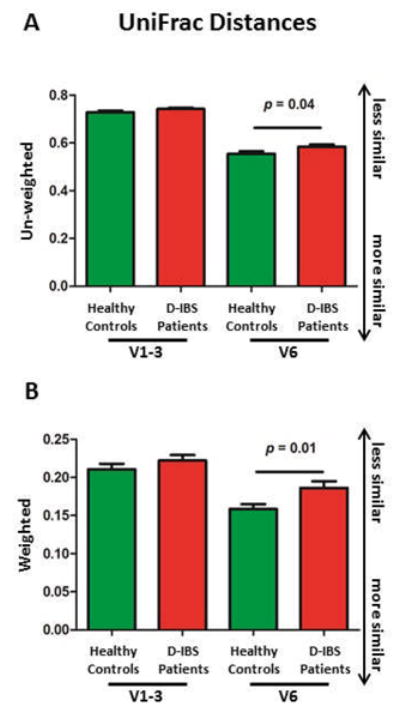
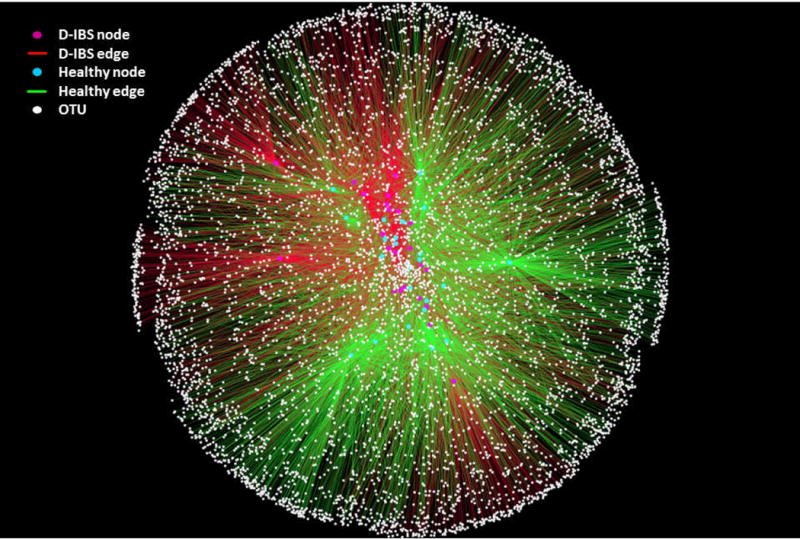
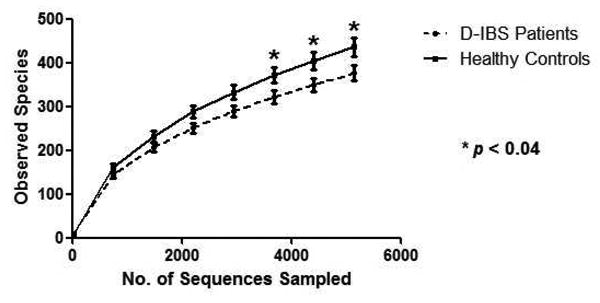
Key results: The contribution of bacterial groups to the composition of the intestinal microbiota differed between D-IBS and HC. D-IBS patients had significantly higher levels of Enterobacteriaceae (P = 0.03), and lower levels of Fecalibacterium genera (P = 0.04) compared to HC. β-Diversity values demonstrated significantly lower levels of UniFrac distances in HC compared to D-IBS patients. The richness of 16S rRNA sequences was significantly decreased in D-IBS patients (P < 0.04).
Conclusions & inferences: Our 16S rRNA sequence data demonstrates a community-level dysbiosis in D-IBS. The altered composition of the intestinal microbiota in D-IBS is associated with significant increases in detrimental and decreases in beneficial bacterial groups, and a reduction in microbial richness.
© 2012 Blackwell Publishing Ltd.
Figures
References
-
- Saito YA, Schoenfeld P, Locke GR., 3rd The epidemiology of irritable bowel syndrome in North America: a systematic review. Am J Gastroenterol. 2002;97(8):1910–5. - PubMed
-
- Hungin AP, Chang L, Locke GR, Dennis EH, Barghout V. Irritable bowel syndrome in the United States: prevalence, symptom patterns and impact. Aliment Pharmacol Ther. 2005;21(11):1365–75. - PubMed
-
- El-Serag HB, Olden K, Bjorkman D. Health-related quality of life among persons with irritable bowel syndrome: a systematic review. Aliment Pharmacol Ther. 2002;16(6):1171–85. - PubMed
-
- Maxion-Bergemann S, Thielecke F, Abel F, Bergemann R. Costs of irritable bowel syndrome in the UK and US. Pharmacoeconomics. 2006;24(1):21–37. - PubMed
-
- Ringel Y, Drossman DA. Irritable Bowel Syndrome. In: Runge MS, Greganti MA, editors. Netter's textbook of Internal Medicine. 2nd. Vol. 59. Sauders Elsevier; 2008. pp. 419–25.
Publication types
MeSH terms
Substances
Grants and funding
LinkOut - more resources
Full Text Sources
Other Literature Sources
Medical
