. 2012 Feb 17;148(4):679-89.
doi: 10.1016/j.cell.2012.01.018.

Mechanism of transcription initiation at an activator-dependent promoter defined by single-molecule observation

Affiliations

Mechanism of transcription initiation at an activator-dependent promoter defined by single-molecule observation

Larry J Friedman et al. Cell. .

Abstract

Understanding the pathway and kinetic mechanisms of transcription initiation is essential for quantitative understanding of gene regulation, but initiation is a multistep process, the features of which can be obscured in bulk analysis. We used a multiwavelength single-molecule fluorescence colocalization approach, CoSMoS, to define the initiation pathway at an activator-dependent bacterial σ(54) promoter that recapitulates characteristic features of eukaryotic promoters activated by enhancer binding proteins. The experiments kinetically characterize all major steps of the initiation process, revealing heretofore unknown features, including reversible formation of two closed complexes with greatly differing stabilities, multiple attempts for each successful formation of an open complex, and efficient release of σ(54) from the polymerase core at the start of transcript synthesis. Open complexes are committed to transcription, suggesting that regulation likely targets earlier steps in the mechanism. CoSMoS is a powerful, generally applicable method to elucidate the mechanisms of transcription and other multistep biochemical processes.


Figures

Figure 1
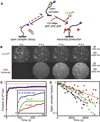
Figure 1. Single-Molecule Observation of Open Complex Formation and Transcript Production
(A) Template schematic. The template contains NtrC-binding enhancer site (red), the glnAP2 σ54RNAP-binding site (white box) and start site (bent arrow), and a transcribed region encoding a U-less RNA containing seven repeats of a 21 bp cassette (green). (B) Stepwise single-molecule transcription experiment. Surface-tethered template molecules (left) form open complexes (middle) with holoenzyme comprised of Cy3 (green star)-σ54 (circle) and core RNAP (ellipse). After transcript production (right), the RNA is detected by hybridization of a Cy5 (red star)-labeled DNA complementary to the repeat cassette. In this and all other experiments in this paper, there is no FRET because the distances separating the dyes are too large. (C–E) False color images (17.6 × 17.6 µm) of a surface region acquired at the three reaction stages depicted in (B). Fluorescence excitation (ex) and emission (em) wavelengths selectively image AF488 (C), Cy3 (D), or Cy5 (E). (F) Positions of spots in the highlighted region of (D) (yellow squares) overlaid with the corresponding region of (C). (G) Positions of spots in the highlighted region of (E) (red boxes) overlaid with the corresponding area of (D). See also Figure S1.
Figure 2
Figure 2. Formation of Closed Complexes
(A) Experimental design. Cy3-σ54RNAP (0.15 nM) is added at time t = 0 to surface-tethered Cy5-template molecules (symbols same as Figure 1A). (B) Cy3-RNAP spots (ex 532 nm; em < 635 nm) at t = 31 s; image 18.1 × 18.1 µm; integration time 3 s. Positions of Cy5-template spots (yellow squares) were observed prior to RNAP addition. (C) Time series images of Cy3 fluorescence from template molecules 1 and 2 in (B). Integration time 1 s; images 1.1 × 1.1 µm. Time interval up to the first binding of Cy3-σ54RNAP is highlighted (red). (D) Cy3 fluorescence intensity records from template molecules 1 through 4 in (B) (traces offset for clarity). Shading marks data shown in (C). (E) Fraction of template molecules that bound RNAP at least once prior to the indicated time in experiments at 0.05, 0.10, and 0.15 nM RNAP (blue; n = 73, 62, and 85) and exponential fits (red) yielding the fraction of binding-competent template molecules (0.92) and kapp, the apparent first-order association rate constants. Inset: Concentration dependence of kapp (blue); values were corrected as described (Extended Experimental Procedures) and fit (red) yielding second-order binding rate constant k1 = (2.1 ± 0.2) × 107 M−1 s−1. Error bars reflect standard errors. See also Figure S2.
Figure 3
Figure 3. Breakdown of Closed Promoter Complexes
(A) Experimental design. Cy3-σ54RNAP bound and dissociated at equilibrium to surface-tethered AF488-template molecules. (B) Cy3 intensity records from five individual template locations (offset for clarity). Lifetimes of individual polymerase-template complexes were measured as the durations of intervals of high fluorescence (arrows). (C) Lifetime distribution of promoter-specific complexes. Binned lifetimes are plotted as corrected probability densities (circles; see Extended Experimental Procedures) overlaid with a biexponential distribution (line) with time constants τS = 2.3 ± 0.5 s, τL = 79 ± 13 s and amplitudes aS = 0.76 ± 0.03, aL = (1 - aS). See also Figure S3.
Figure 4
Figure 4. Overall Initiation Rate
(A) Experimental design; RNAP was at 8 nM. (B) Image of template molecules taken before RNAP addition (blue) and selected images (red) from a recording of probe hybridization at times after RNAP addition (frame duration 1 s). (C) Template spot fraction that had a colocalized probe spot at or before the time shown (red). Exponential fit (black) yields initiation rate (1.2 ± 0.1) × 10−3 s−1 and active fraction 0.61 (n = 145). See also Figure S5.
Figure 5
Figure 5. Characterization of RNAP Binding Events that Lead to Transcript Production
Reaction was the same as in Figure 4A but with 0.8 nM RNAP and 20 nM probe. (A) Fluorescence from RNAP at the location of a single DNA molecule (em < 635 nm) and transcript probe (em > 635 nm). (Left) RNAP and transcript probe emission recording. (Right) Time series of images (1 × 1 µm, 2 s frame duration with 2 frame running average) from the shaded interval in the recordings (series is split into three rows with paired Cy3 [top] and Cy5 [bottom] images at each time). For the initiation event (green and red squares; see text), the apparent duration of the Cy3-σ54 presence on the template (Δtσ) and the time interval separating Cy3-σ54 departure from a transcript probe hybridization (Δthyb) are marked. (B) (Blue) Normalized histogram showing 53 of 63 measurements of Δthyb (the remaining ten measurements are outside of the plotted range). By convention, we take Δthyb to be positive when the Cy5 hybridization signal appears on a template after Cy3-σ54 has departed. (Red) A control randomized analysis of the same data (see text). (C) Distribution Δtσ (circles) for all 63 binding events that most closely preceded transcript detection. Exponential fit (line) yields time constant 78 ± 10 s. (Inset) Distribution of Δtσ from the randomized sampling control used in (B) (red). See also Figure S6 and Movie S1.
Figure 6
Figure 6. Fates of Open Promoter Complexes
(A) Experimental designs. Open promoter complexes (as in Figure 1D) were incubated in the absence of free RNAP for > 15 min to dissociate any residual closed complexes and then were subjected to conditions that allowed either spontaneous dissociation (left) or transcript production (right). (B) Images from a recording of transcript production from open complexes upon addition of 1 mM ATP, 0.5 mM CTP, 0.5 mM GTP, and 5 nM probe. (C) Fraction of open complexes that lost σ54 prior to the indicated time and that also synthesized transcript (n = 91). Transcript production reaction in 4 mM ATP, 0.5 mM CTP, 0.5 mM GTP, 5 nM Cy5 probe plus NtrC. Dashed line indicates fraction of active complexes as judged by σ54 departure. Biexponential fit (line) yields rate constants 0.17 and 4.3 × 10⁻³ s−1 and amplitudes 0.92 and 0.08, respectively. (Inset) Similar experiments performed without NtrC and at reduced NTP concentrations (n = 47 to 81). (D) Dissociation of open complexes in buffer (blue) plus 4 mM ATP (green) and plus ATP and NtrC (red). (Circles) Photobleaching-corrected fraction of complexes containing Cy3-σ54; (lines) exponential fits yielding rates of 1.9 ± 0.2 × 10⁻⁴, 1.57 ± 0.08 × 10⁻⁴, and 1.0 ± 0.1 × 10⁻⁴ s−1, respectively. Each experiment sampled nine fields of view with initial averages of 42, 44, and 31 open complexes in each field, respectively. See also Figure S7, Table S1, and Movie S1.
Figure 7
Figure 7. Mechanism of σ54RNAP Initiation
Nested boxes (black, green, and red) specify the combination of reactants needed to produce the different reactions and states. Numbers in parentheses are the standard error of the final digit of the corresponding rate constant. The isomerization step (green) is shown as two separated arrows to denote that the forward reaction, which requires ATP, is not the reverse of the backward reaction, which does not require ADP + Pi. See also Figure S4 and Table S2.

Comment in

Similar articles

Cited by

References

    1. Amit R, Garcia HG, Phillips R, Fraser SE. Building enhancers from the ground up: a synthetic biology approach. Cell. 2011;146:105–118. - PMC - PubMed
    1. Bar-Nahum G, Nudler E. Isolation and characterization of σ70-retaining transcription elongation complexes from Escherichia coli. Cell. 2001;106:443–451. - PubMed
    1. Bernardo LM, Johansson LU, Solera D, Skärfstad E, Shingler V. The guanosine tetraphosphate (ppGpp) alarmone, DksA and promoter affinity for RNA polymerase in regulation of σ54-dependent transcription. Mol. Microbiol. 2006;60:749–764. - PubMed
    1. Bondarenko V, Liu Y, Ninfa A, Studitsky VM. Action of prokaryotic enhancer over a distance does not require continued presence of promoter-bound σ54 subunit. Nucleic Acids Res. 2002;30:636–642. - PMC - PubMed
    1. Bose D, Pape T, Burrows PC, Rappas M, Wigneshweraraj SR, Buck M, Zhang X. Organization of an activator-bound RNA polymerase holoenzyme. Mol. Cell. 2008;32:337–346. - PMC - PubMed

Publication types

MeSH terms