. 2012 Feb 17;148(4):716-26.
doi: 10.1016/j.cell.2011.12.027.

Mitochondrial stress engages E2F1 apoptotic signaling to cause deafness

Affiliations

Mitochondrial stress engages E2F1 apoptotic signaling to cause deafness

Nuno Raimundo et al. Cell. .

Abstract

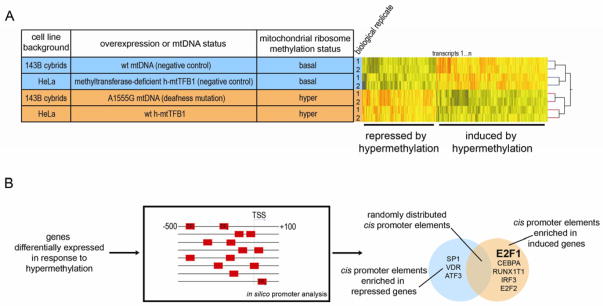
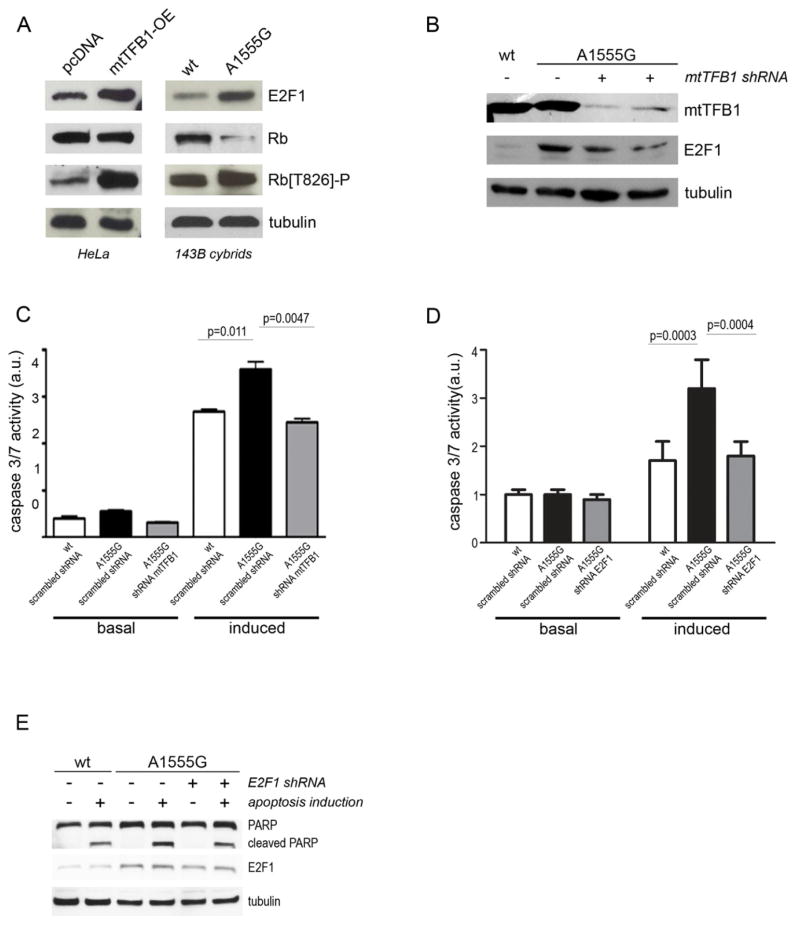
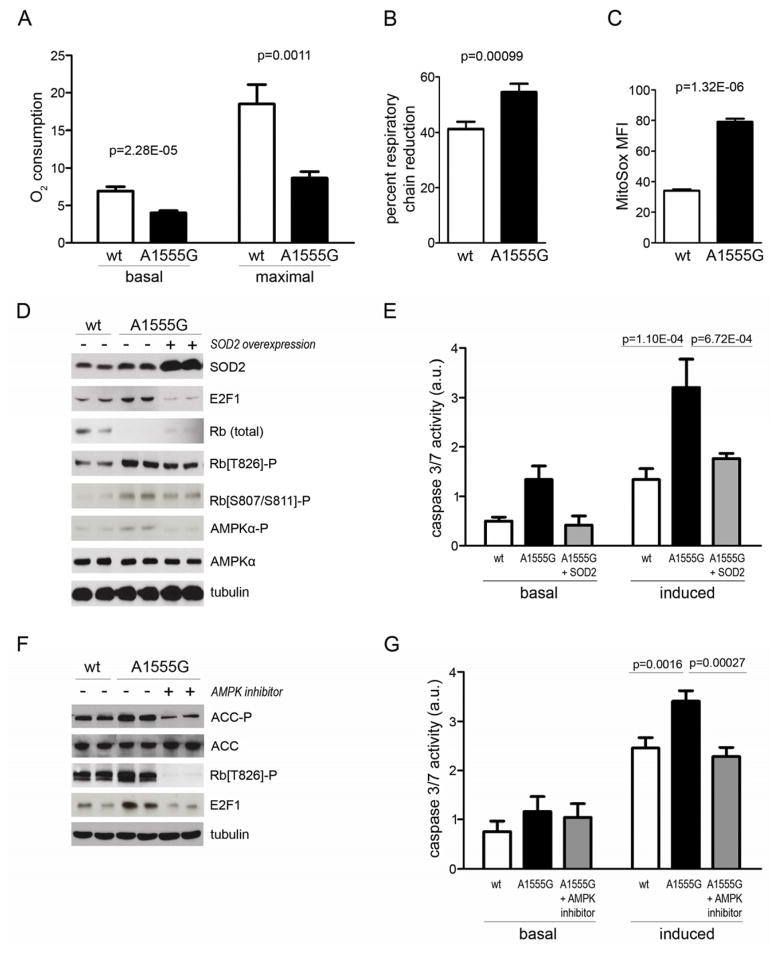
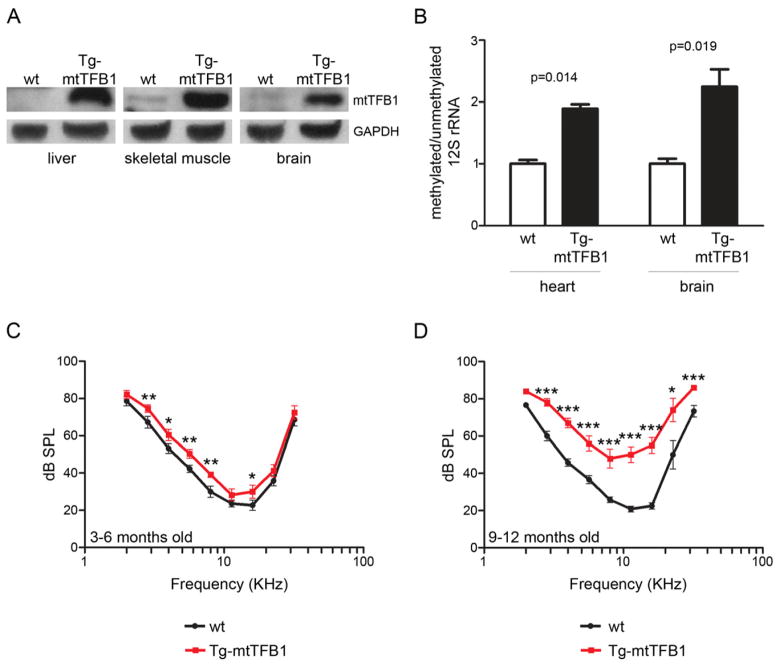
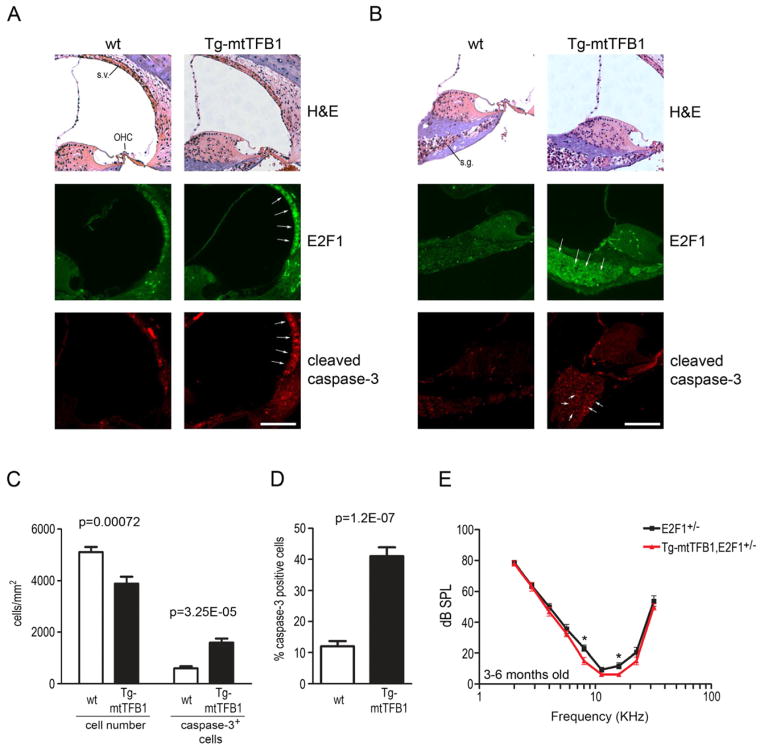
Mitochondrial dysfunction causes poorly understood tissue-specific pathology stemming from primary defects in respiration, coupled with altered reactive oxygen species (ROS), metabolic signaling, and apoptosis. The A1555G mtDNA mutation that causes maternally inherited deafness disrupts mitochondrial ribosome function, in part, via increased methylation of the mitochondrial 12S rRNA by the methyltransferase mtTFB1. In patient-derived A1555G cells, we show that 12S rRNA hypermethylation causes ROS-dependent activation of AMP kinase and the proapoptotic nuclear transcription factor E2F1. This retrograde mitochondrial-stress relay is operative in vivo, as transgenic-mtTFB1 mice exhibit enhanced 12S rRNA methylation in multiple tissues, increased E2F1 and apoptosis in the stria vascularis and spiral ganglion neurons of the inner ear, and progressive E2F1-dependent hearing loss. This mouse mitochondrial disease model provides a robust platform for deciphering the complex tissue specificity of human mitochondrial-based disorders, as well as the precise pathogenic mechanism of maternally inherited deafness and its exacerbation by environmental factors.


Figures

Figure 1
Figure 1. Integrative genomic analysis reveals up-regulation of nuclear transcription factor E2F1 in response to mitochondrial stress induced by mitochondrial ribosome hyper-methylation
(A) Table showing the four cell lines on which we performed microarray analysis to develop a signature of the gene expression response to mitochondrial 12S hyper-methylation: two control lines with “basal” mitochondrial 12S hyper-methylation (blue) and two experimental cell lines with 12S hyper-methylation (orange), with the number of biological replicates indicated. To the right of the table is the representative heat map of all replicates of the cell lines analyzed, with transcripts that are induced or repressed depending on 12S hyper-methylation status delineated. “wt” indicates wild-type with regard to either mtDNA or h-mtTFB1. Transcripts whose expression was significantly different (t-test p-value<0.05) between the two groups (“basal” versus “hyper”-methylated) represented a 12S hyper-methylation signature list that was analyzed further (total of 4333 transcripts, 2492 induced and 1841 repressed). (B) The promoter regions (−500 to +100 bp of the predicted transcription initiation site) of the genes that were differentially expressed were analyzed for known transcription factor binding sites. The Venn diagram indicates the top transcription factors identified in the repressed (blue) and induced (orange) genes. Since E2F1 was the most over-represented binding site in the genes induced by 12S rRNA hyper-methylation it became a focus of this study.
Figure 2
Figure 2. Hyper-methylation of mitochondrial 12S rRNA leads to activation of E2F1 and E2F1-dependent apoptosis
(A) Western blot analysis of whole cell extracts for E2F1, Rb and phosphorylated-Rb, (Rb[T268]-P) in HeLa cells that over-express h-mtTFB1 (h-mtTFB1-OE) compared to cell containing an empty-vector negative control (pcDNA), and in human 143B cybrids containing wild-type (wt) or A1555G mtDNA. Tubulin was probed as a loading control. Quantification is shown in Figure S1B. (B) Effect of h-mtTFB1 knock-down (to reduce 12S hyper-methylation) on E2F1 levels in A1555G cybrids by Western blot using tubulin as a loading control. Two independent knock-down constructs were used (+), and a scrambled shRNA was used as a negative control (−). 143B cybrids with wild-type (wt) mtDNA treated with the negative control shRNA are shown in lane 1. Quantification is shown in Figure S1C. (C) Quantitation of apoptosis (caspase 3/7 activity) in 143B cybrids containing wild-type (wt) or A1555G mtDNA without (−) or with (+) h-mtTFB1 knocked down by shRNA (see Figure S2A). Basal and induced apoptosis refer to the presence and absence of staurosporine. The values plotted represent mean ± standard deviation (n=12), with t-test p-values indicated. (D) Quantitation of apoptosis (caspase 3/7 activity) in 143B cybrids containing wild-type (wt) or A1555G mtDNA without (−) or with (+) E2F1 knocked down by shRNA. Basal and induced apoptosis refer to the presence and absence of staurosporine. The values plotted represent mean ± standard deviation (n=12), with t-test p-values indicated. (E) Western blot analysis of full-length and cleaved PARP and of E2F1 in wild-type (wt) and A1555G treated with scrambled (−) or E2F1 (+) shRNA without (−) or with (+) induction of apoptosis by starosporine. E2F1, full-length (PARP) and caspase-3-cleaved forms of PARP are shown, with tubulin probed as a loading control. Quantification is shown in Figure S1D.
Figure 3
Figure 3. A pro-apoptotic mitochondrial stress-signaling pathway that involves mitochondrial ROS-dependent activation of E2F1 by AMP kinase
(A) Basal and maximal (+ FCCP uncoupler) mitochondrial O2 consumption rates in 143B cybrids containing wild-type (wt) or A1555G mtDNA are shown. The mean ± standard deviation (n=24) is plotted, with t-test p-values indicated. (B) Degree of respiratory chain reduction in the same cells as in (A). This is the ratio of basal to maximal respiration, the latter of which was considered 100% reduction (i.e. the chain handling the maximal amount of electrons). The mean ± standard deviation (n=12) is plotted, with t-test p-values indicated. (C) Mitochondrial ROS in 143B cybrids containing wild-type (wt) or A1555G mtDNA as measured by FACS analysis of MitoSox staining. The mean fluorescence intensity ± standard deviation is plotted (n=3), with t-test p-values indicated. (D) Western blot analysis of A1555G cybrids that overexpress SOD2. Immunoblotting of E2F1, Rb, phospho-Rb T826 and S807/811, AMPKα and phospho-AMPKα T172 are shown in A1555G cybrids transfected with the SOD2 over-expression vector (lanes 5–6), and in control cybrids with wild-type mtDNA (“wt”, lanes 1–2) and A1555G mtDNA (lanes 3–4) transfected with empty vector. Lanes 1–2, 3–4 and 5–6 represent independent biological replicates. Tubulin was probed as a loading control. (E) Quantitation of apoptosis (caspase 3/7 activity) in 143B cybrids containing wild-type (wt) mtDNA (white bars) or A1555G mtDNA without (black bars) or with SOD2 over-expression (grey bars). Basal and induced apoptosis refer to the presence and absence of staurosporine. The values plotted represent mean ± standard deviation (n=12), with t-test p-values indicated. (F) Effect of pharmacological AMPK inhibition on the levels of acetyl-CoA carboxylase (ACC), phospho-ACC S79 (ACC-P), phospho-Rb T826 and E2F1 in A1555G cybrids (lanes 5–6), determined by western blot of whole cell extracts using tubulin as a loading control. Lanes 1–2 (wild-type cybrids) and 3–4 (A1555G cybrids) are the vehicle controls (−). The lanes 1–2, 3–4 and 5–6 represent independent biological replicates. (G) Quantitation of apoptosis (caspase 3/7 activity) in 143B cybrids containing wild-type (wt) mtDNA (white bars), or A1555G mtDNA without (black bars) or with AMPK inhibition (grey bars). Basal and induced apoptosis refer to the presence and absence of staurosporine. The values plotted represent mean ± standard deviation (n=12), with t-test p-values indicated.
Figure 4
Figure 4. Transgenic mice that over-express the mtTFB1 rRNA methyltransferase exhibit 12S hyper-methylation and progressive hearing loss
(A) Western blot of mtTFB1 in wild-type (wt) and transgenic mtTFB1 (Tg-mtTFB1) mouse tissues using GAPDH as loading control. (B) Quantification of the degree of 12S rRNA methylation in Tg-mtTFB1 mouse heart and brain tissues using a methylation-sensitive mitochondrial 12S rRNA primer-extension assay (Cotney et al., 2009). The values plotted represent mean of methylated/unmethylated ± standard deviation (n=3), with t-test p-values indicated. (C) Hearing thresholds determined by ABR analysis of Tg-mtTFB1 (red points) and control wild-type (wt), non-transgenic littermate control mice (black points) are shown in the audiogram (frequency vs. threshold curve). The threshold (in sound pressure level, dB SPL) was tested with 5-dB resolution and frequencies in half octave steps from 32 to 2 kHz. The values plotted represent mean ± standard error of the mean, with t-test p-values indicated (*, p<0.05; **, p<0.01; ***, p<0.001). Mice were tested at ages 3–6 months (9 wt mice and 12 Tg-mtTFB1 mice were used). (D) same as in (C) except mice were tested at ages 9–12 months (5 wild-type mice and 6 Tg-mtTFB1 mice were used).
Figure 5
Figure 5. Deafness pathology in Tg-mtTFB1 mice involves up-regulation of E2F1 and apoptosis in the stria vascularis and spinal ganglion neurons of the inner ear
(A) H&E staining of the organ of Corti and stria vascularis (top panels) from representative 1-year old wild-type (wt, left column) and Tg-mtTFB1 mice (right column). The middle panels show immunohistochemistry staining for E2F1 and the lower panels show immunohistochemistry for cleaved caspase-3 in similar representative sections. White arrows indicate areas where significant changes in signal are observed. Stria vascularis (s.v.), outer hair cells (OHC), scale bar, 100μm. See also Figure S2. (B) same as in (A) but sections that highlight staining in the spiral ganglion neurons are shown. Spiral ganglion (s.g.), scale bar, 100μm. (C) quantification of cellular density in the spiral ganglion (the left side of the plot) and of caspase-3 positive spiral ganglion neurons (right side). The sections were obtained from 3 wild-type and 3 Tg-mtTFB1 mice at 1 year of age, and six independent sections were counted for each animal. The values plotted represent mean ± standard deviation, with t-test p-values indicated. (D) same as in (C), but expressing the percentage of caspase-3 positive cells in the spiral ganglion. The values plotted represent mean ± standard deviation, with t-test p-values indicated. (E) ABR analysis of E2F1+/− mice (black points) and E2F1+/−/Tg-mtTFB1 mice (red points) performed as described in Figure 4C (n=). Mice were tested at ages 3–6 months (8 E2F1+/− mice and 10 E2F1+/−/Tg-mtTFB1 mice were used). The values plotted represent mean ± standard error of the mean, with t-test p-values indicated (*, p<0.05).

References

    1. Bonawitz ND, Clayton DA, Shadel GS. Initiation and beyond: multiple functions of the human mitochondrial transcription machinery. Mol Cell. 2006;24:813–825. - PubMed
    1. Butow RA, Avadhani NG. Mitochondrial signaling: the retrograde response. Mol Cell. 2004;14:1–15. - PubMed
    1. Bykhovskaya Y, Mengesha E, Wang D, Yang H, Estivill X, Shohat M, Fischel-Ghodsian N. Human mitochondrial transcription factor B1 as a modifier gene for hearing loss associated with the mitochondrial A1555G mutation. Mol Genet Metab. 2004;82:27–32. - PubMed
    1. Chen P, Zindy F, Abdala C, Liu F, Li X, Roussel MF, Segil N. Progressive hearing loss in mice lacking the cyclin-dependent kinase inhibitor Ink4d. Nat Cell Biol. 2003;5:422–426. - PubMed
    1. Cotney J, McKay SE, Shadel GS. Elucidation of separate, but collaborative functions of the rRNA methyltransferase-related human mitochondrial transcription factors B1 and B2 in mitochondrial biogenesis reveals new insight into maternally inherited deafness. Hum Mol Genet. 2009;18:2670–2682. - PMC - PubMed

Publication types

MeSH terms

Associated data