. 2012 Feb 17;148(4):739-51.
doi: 10.1016/j.cell.2011.12.031.

Immune surveillance and therapy of lymphomas driven by Epstein-Barr virus protein LMP1 in a mouse model

Affiliations

Immune surveillance and therapy of lymphomas driven by Epstein-Barr virus protein LMP1 in a mouse model

Baochun Zhang et al. Cell. .

Abstract

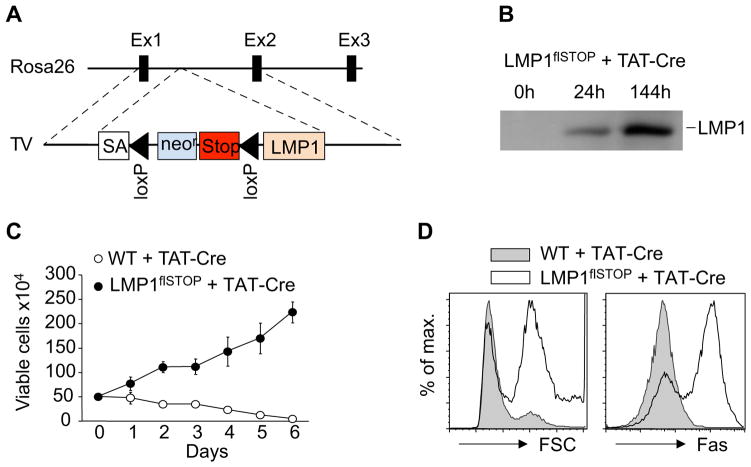
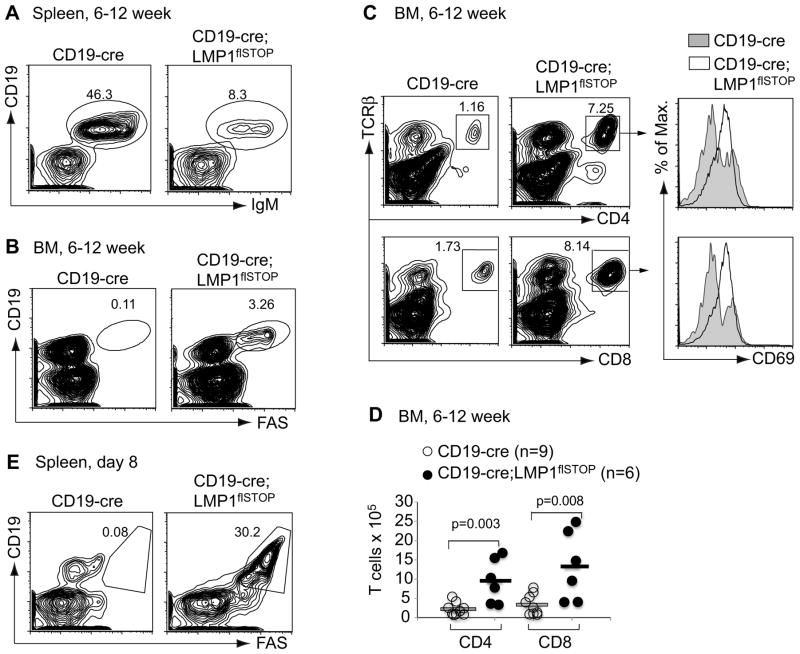
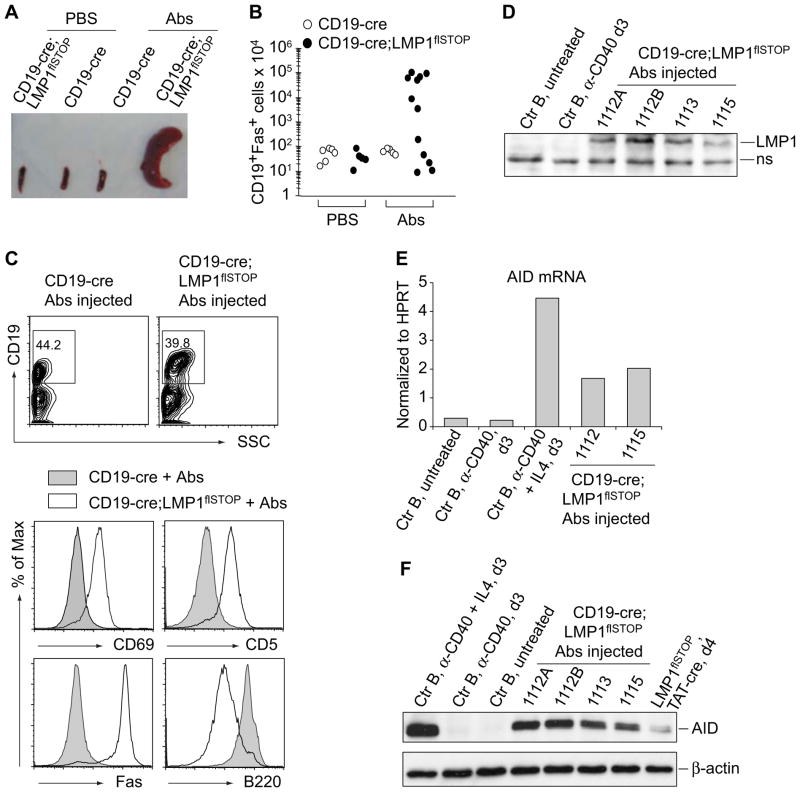
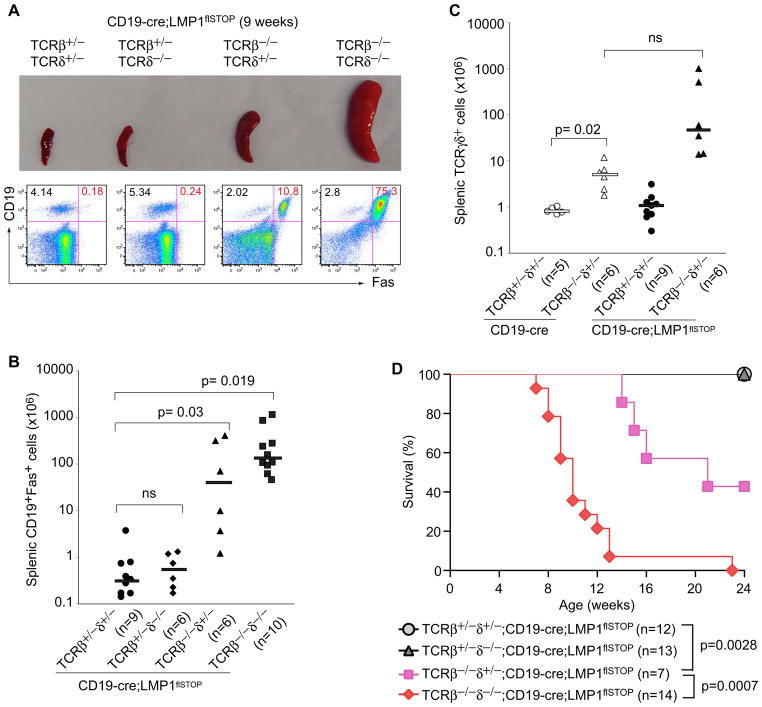
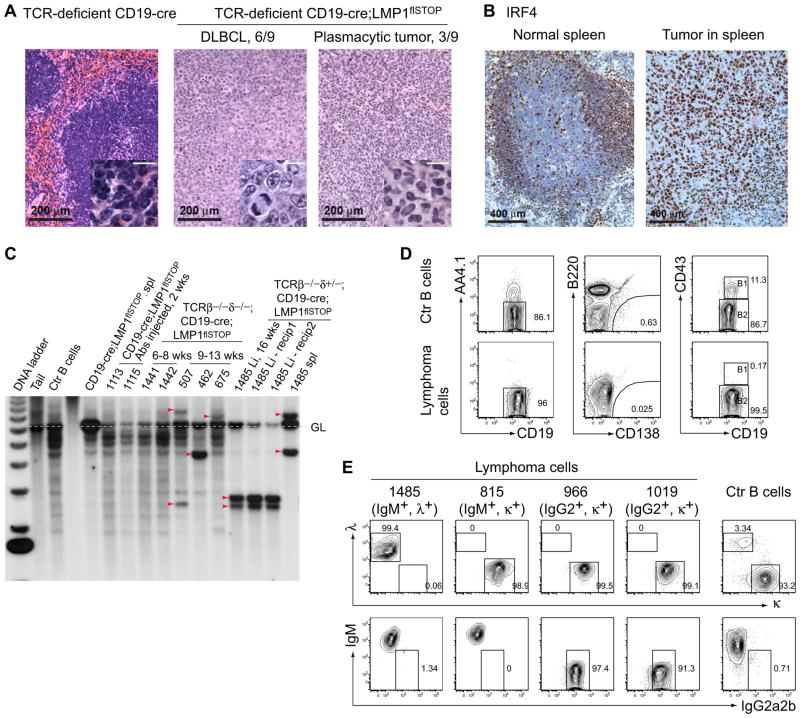
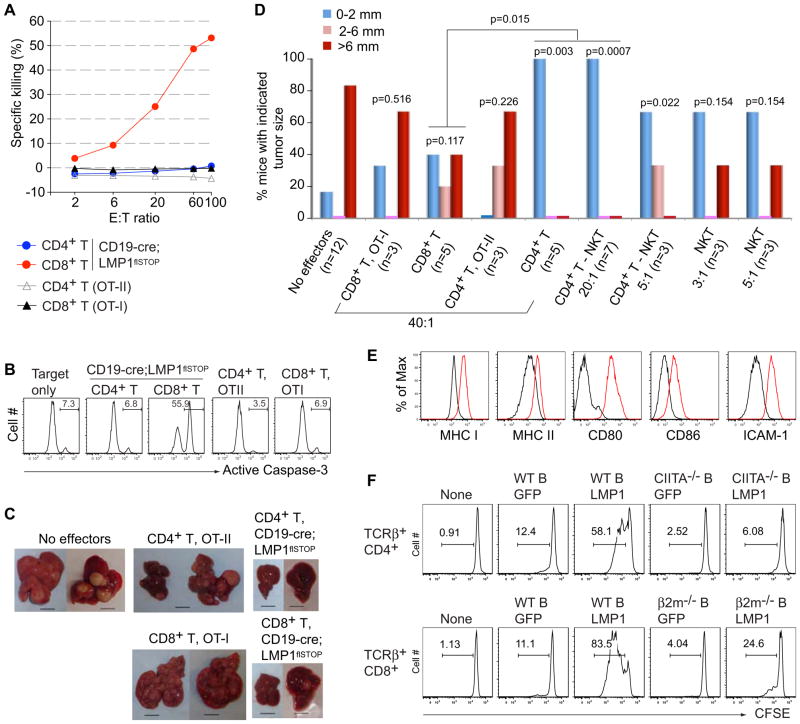
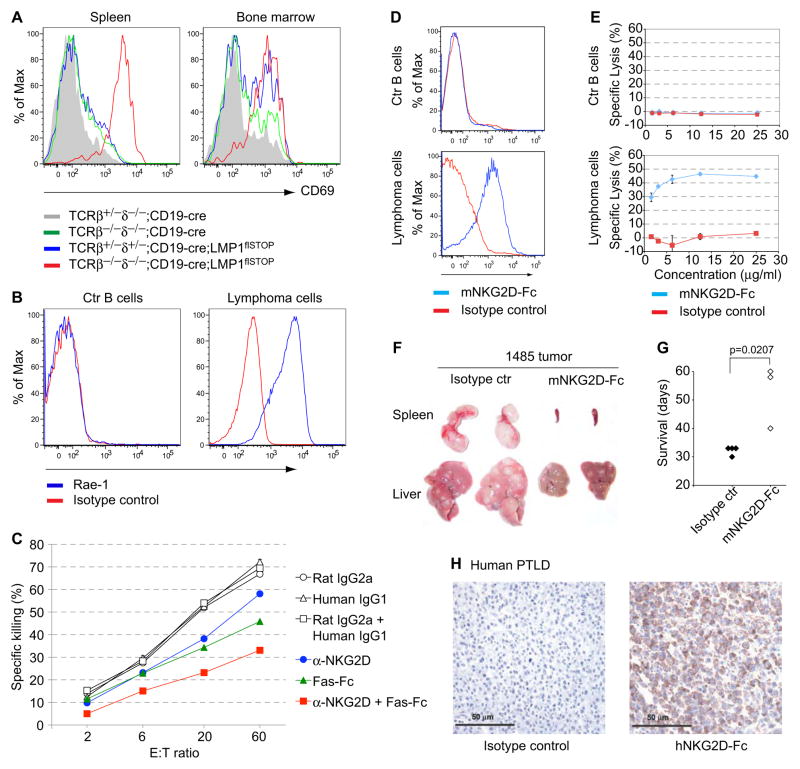
B cells infected by Epstein-Barr virus (EBV), a transforming virus endemic in humans, are rapidly cleared by the immune system, but some cells harboring the virus persist for life. Under conditions of immunosuppression, EBV can spread from these cells and cause life-threatening pathologies. We have generated mice expressing the transforming EBV latent membrane protein 1 (LMP1), mimicking a constitutively active CD40 coreceptor, specifically in B cells. Like human EBV-infected cells, LMP1+ B cells were efficiently eliminated by T cells, and breaking immune surveillance resulted in rapid, fatal lymphoproliferation and lymphomagenesis. The lymphoma cells expressed ligands for a natural killer (NK) cell receptor, NKG2D, and could be targeted by an NKG2D-Fc fusion protein. These experiments indicate a central role for LMP1 in the surveillance and transformation of EBV-infected B cells in vivo, establish a preclinical model for B cell lymphomagenesis in immunosuppressed patients, and validate a new therapeutic approach.


Conflict of interest statement

The authors declare no conflict of interest.

Figures

Figure 1
Figure 1. Expression of Transgenic LMP1 Promotes B Cell Growth In Vitro
(A) Targeting the conditional LMP1 allele into the Rosa26 locus. TV, targeting vector; SA, splice acceptor. (B) Immunoblotting of LMP1 in CD43-depleted splenic B cells from LMP1flSTOP mice at the indicated time points following TAT-Cre treatment. (C) Proliferation of TAT-Cre treated splenic B cells from LMP1flSTOP and wild-type (WT) mice in culture. Data represent means of 4 parallel measurements ± s.d. (D) FACS analysis of cell size (left panel) and Fas expression (right panel) of such cells two days after TAT-Cre treatment. Data in (C) and (D) are representative of two independent experiments.
Figure 2
Figure 2. Elimination of LMP1+ B Cells and Activation of T Cells in CD19- cre;LMP1flSTOP Mice
(A and B) Representative FACS analysis of spleen and BM cells from 6–12 week old CD19-cre and CD19-cre;LMP1flSTOP mice, respectively. (C) Representative FACS analysis of T cells and their activation status (CD69 expression) in the BM of these mice. Boxed, percentage within lymphocyte gate. (D) Numbers of CD4+TCRβ+ and CD8+TCRβ+ T cells in the BM of these mice. Bars show the respective mean values. (E) Representative FACS analysis of spleen cells from CD19-cre and CD19-cre;LMP1flSTOP mice on day 8 after birth. CD19+Fas+ indicates LMP1+ B cells. See also Figure S1 and Figure S2.
Figure 3
Figure 3. Disruption of Immune Surveillance Leads to Rapid, Fatal Lymphoproliferation in CD19-cre;LMP1flSTOP Mice
(A) Representative spleens of CD19-cre and CD19-cre;LMP1flSTOP mice repetitively treated with anti-CD4, -CD8 and -Thy1 antibodies (Abs) or PBS for 13–16 days. (B) Numbers of CD19+Fas+ splenic B cells from mice as in (A). Each dot indicates one mouse. (C) FACS analysis of splenocytes from indicated mice. In lower panels, analysis was on CD19+ cells. (D) Immunoblotting of LMP1. Ctr B, CD43-depleted splenic B cells from CD19-cre mice; d3, day 3; the 4 lanes from the right, splenic B cells from antibody-injected CD19-cre;LMP1flSTOP mice; ns, non-specific. (E and F) Real-time RT-PCR (E) and immunoblotting (F) of AID in splenic B cells treated as indicated or isolated from antibody-injected CD19-cre;LMP1flSTOP mice, respectively. Ctr B, CD43-depleted splenic B cells from C57BL/6 mice; d3, day 3; the most right lane in (F), splenic B cells from LMP1flSTOP mice cultured for 4 days after TAT-Cre treatment. See also Figure S3.
Figure 4
Figure 4. TCRαβ T Cells Are Major Effectors in Controlling LMP1-Expressing B Cells, and TCRγδ T Cells also Contribute
(A) Spleens from 9 week old CD19-cre;LMP1flSTOP mice of the indicated genotypes for TCRβ and -δ alleles. The lower panel shows the FACS analysis of the corresponding splenic lymphocytes. CD19+Fas+ cells represent LMP1+ B cells. (B) Numbers of CD19+Fas+ cells (LMP1+ B cells) in spleens of 8–11 week old CD19-cre;LMP1flSTOP mice of the indicated genotypes for TCRβ and -δ alleles. (C) Numbers of TCRγδ+ cells in spleens of 8–11 week old CD19-cre and CD19-cre;LMP1flSTOP mice of the indicated genotypes for TCRβ and -δ alleles. Bars in (B) and (C) show the respective median values. (D) Survival of CD19-cre;LMP1flSTOP mice of the indicated genotypes for TCRβ and -δ alleles.
Figure 5
Figure 5. Clonal B-Cell Lymphomas Arising in TCR-Deficient CD19-cre;LMP1flSTOP Mice
(A) H&E staining of spleen sections from a healthy control animal (left) and two terminally ill mice (middle and right) of the indicated genotypes. 6/9 animals developed Diffuse Large B-cell Lymphoma (DLBCL) and 3/9 plasmacytic tumors, as judged by their histological appearance. Scale bars in insets, 20 μm. (B) Immunohistochemical staining of IRF4 on spleen sections from a control animal (left) and a TCR-deficient CD19-cre;LMP1flSTOP animal carrying a tumor (right). 5/5 tumors were IRF4 positive. (C) Southern blot analysis of rearranged Ig VDJ and DJ gene segments in B cells from the indicated mice. The 4 lanes on the right depict mouse #1485, where separate tumors developed in spleen (spl) and liver (Li). Tumors could be transplanted into immunodeficient recipients (Rag2−/−γc−/−) as exemplified for the #1485 tumor in the liver. Dashed line, germline IgH configuration; wks, weeks. (D and E) FACS analysis of four tumor lines. Data in (D) show representative analysis of one tumor line (966); Ctr B cells from the spleen of a (C57BL/6×BALB/c) F1 mouse. See also Figure S4 and Table S1.
Figure 6
Figure 6. CD4+ and CD8+ T Cells Control LMP1+ Tumor Cells
(A) In vitro killing of LMP1+ tumor cells (line 966) by CD8+ T cells from CD19-cre;LMP1flSTOP mice, but not by CD4+ T cells from these mice or CD8+ and CD4+ T cells from OT-I and OT-II transgenic mice, respectively. E:T ratio, effector:target cell ratios. (B) Representative active Caspase-3 staining on the target cells (CD19+, tumor cells) is shown for a set of killing assays at an effector:target ratio of 60. Active Caspase-3 staining indicates apoptotic cells. (C) Representative pictures showing tumor nodules in livers of Rag2−/−γc−/− animals transplanted with 1 × 10⁴ lymphoma cells (line 966) either alone or together with 4 × 10⁵ of the indicated T cells. Mice were analyzed on day 30 after transplantation. Scale bars, 10 mm. (D) Summary of tumor nodule sizes in Rag2−/−γc−/− animals transplanted with 1 × 10⁴ lymphoma cells either alone or together with the indicated effectors at various effector:tumor cell ratios. All effector cells were derived from CD19-cre;LMP1flSTOP mice except as indicated. Numbers (n) of animals for each group are shown in the parentheses; CD4+ T-NKT, conventional CD4+ T cells. p values were calculated using Fisher’s exact test comparing the various groups to the “No effectors” control, or as indicated. Analysis of recipient mice on day 30 post-transfer revealed the absence of contaminating CD8+ cells in recipients of CD4+ cells and vice versa (Figure S5C and data not shown). (E) FACS analysis of the indicated antigens on CD19+ cells from the spleen of C57BL/6 mice (black line) and CD19+Fas+ (LMP1+) cells from the spleen of TCRβ−/−δ−/−;CD19-cre;LMP1flSTOP mice (red line). (F) Proliferation, monitored by CFSE dilution, of CD4+ and CD8+ T cells from CD19-cre;LMP1flSTOP mice cultured either alone or together with GFP or LMP1-expressing B cells from the indicated mice. Data in (A) are representative of three independent experiments, (C–D) are from at least two experiments, except for the OT-II CD4+ and OT-I CD8+ T cells, (E) are representative of 2–5 mice of each genotype, and (F) of two experiments. See also Figure S5.
Figure 7
Figure 7. Reduced Tumor Growth in Transplanted Animals Receiving an NKG2D-Fc Fusion Protein
(A) Staining for the activation marker CD69 on NK cells (DX5+NK1.1+CD3) from the indicated mice. (B) Staining of normal CD19+ B cells (Ctr B cells) from a TCRβ+/−δ−/−;C D19-cre mouse and primary lymphoma cells from a T cell-deficient CD19-cre;LMP1flSTOP mouse for expression of Rae-1. (C) Killing of LMP1+ tumor cells (line 966) by NK cells from CD19-cre;LMP1flSTOP mice in the presence of the indicated antibodies. NKG2D blocking antibody, MI6; Fas-Fc, Fas-ligand neutralizing fusion protein; rat IgG2a and human IgG1 served as controls for MI6 and Fas-Fc, respectively. Data in (A) represent three mice of each genotype, in (B) two primary lymphomas and three established lymphoma lines, and in (C) three experiments. (D) Staining of the Ctr B cells and lymphoma cell lines for binding of mNKG2D-Fc fusion protein. (E) Lysis of these cells upon incubation with rabbit complement plus mNKG2D-Fc fusion protein or isotype control (mouse IgG2a) for 2 hours. Data indicate means ± s.e.m. (F) Spleens and livers from Rag2−/−γc−/− animals transplanted with lymphoma cells (line 1485), repetitively treated with mNKG2D-Fc or isotype control, and analyzed on day 33 after tumor transplantation. (G) Survival of mice transplanted with lymphoma cells and treated as in (F). Each dot indicates one mouse. Data in (D–G) are representative of three tumor lines tested. (H) A representative human EBV+ PTLD sample stained with a hNKG2D-Fc fusion protein or isotype control mouse IgG2a. 6/6 EBV+ PTLDs were stained with similar results. See also Figure S6.

References

    1. Balkwill F. Tumour necrosis factor and cancer. Nat Rev Cancer. 2009;9:361–371. - PubMed
    1. Barnden MJ, Allison J, Heath WR, Carbone FR. Defective TCR expression in transgenic mice constructed using cDNA-based alpha- and beta-chain genes under the control of heterologous regulatory elements. Immunol Cell Biol. 1998;76:34–40. - PubMed
    1. Blankenstein T, Qin Z. The role of IFN-gamma in tumor transplantation immunity and inhibition of chemical carcinogenesis. Curr Opin Immunol. 2003;15:148–154. - PubMed
    1. Boon T, Coulie PG, Van den Eynde BJ, van der Bruggen P. Human T cell responses against melanoma. Annu Rev Immunol. 2006;24:175–208. - PubMed
    1. Caldwell RG, Wilson JB, Anderson SJ, Longnecker R. Epstein-Barr virus LMP2A drives B cell development and survival in the absence of normal B cell receptor signals. Immunity. 1998;9:405–411. - PubMed

Publication types

Substances