. 2012 Feb 17;148(4):816-31.
doi: 10.1016/j.cell.2011.12.035.

Base-resolution analyses of sequence and parent-of-origin dependent DNA methylation in the mouse genome

Affiliations

Base-resolution analyses of sequence and parent-of-origin dependent DNA methylation in the mouse genome

Wei Xie et al. Cell. .

Abstract

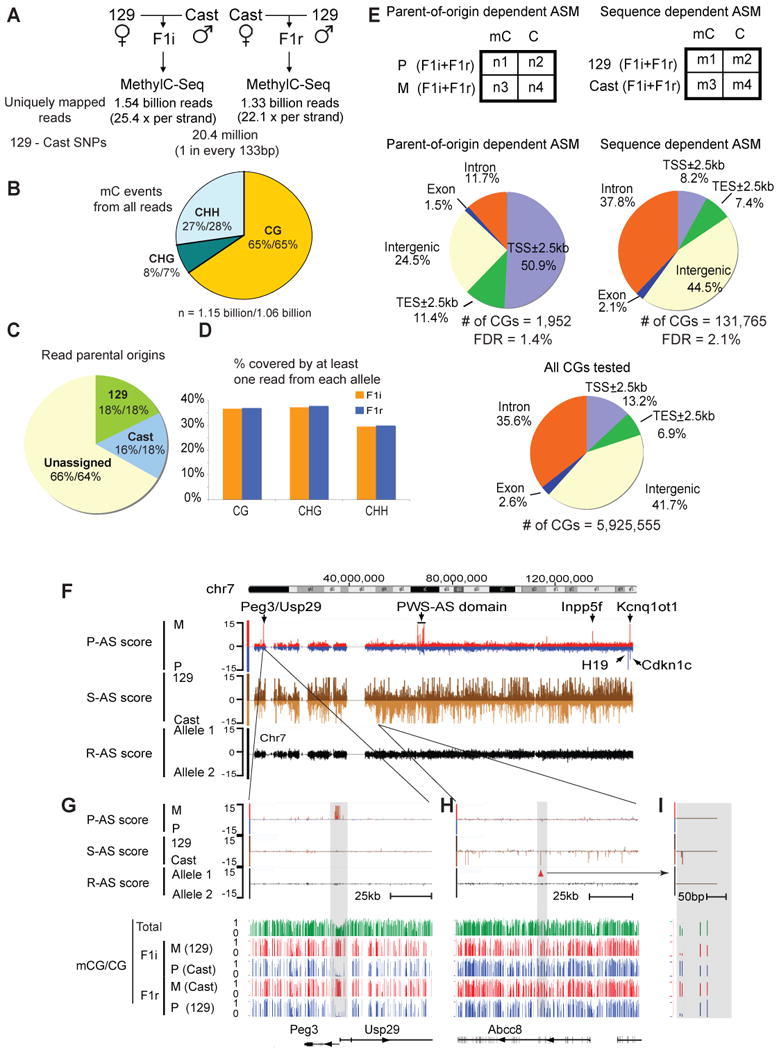
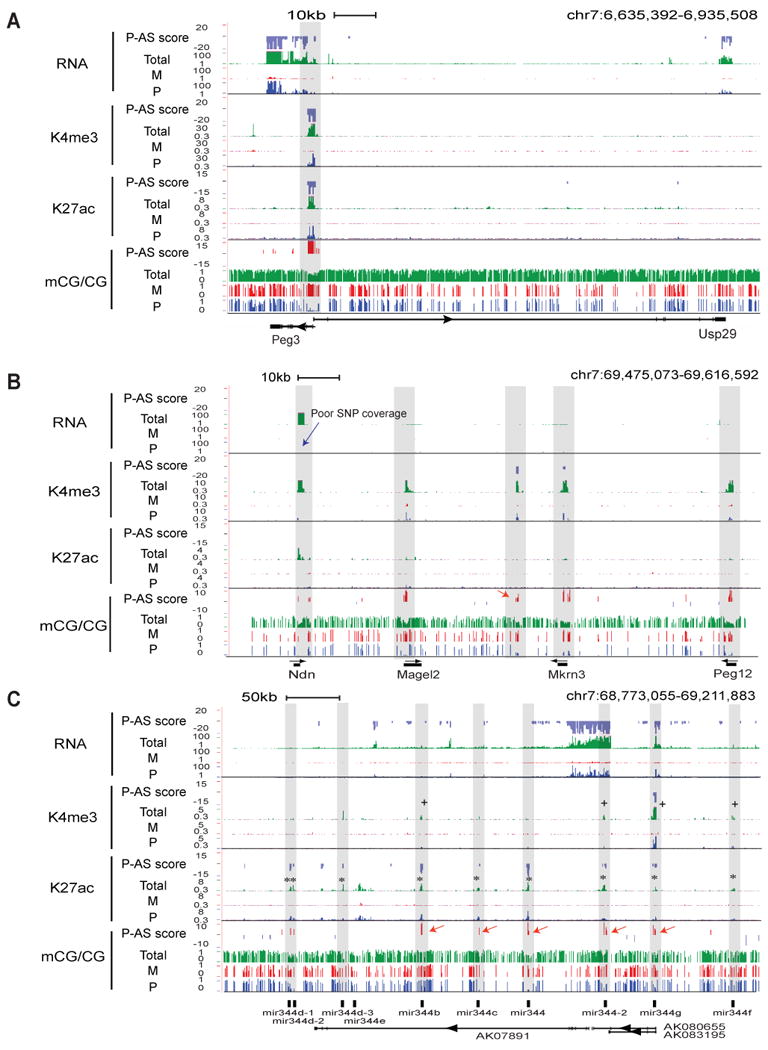
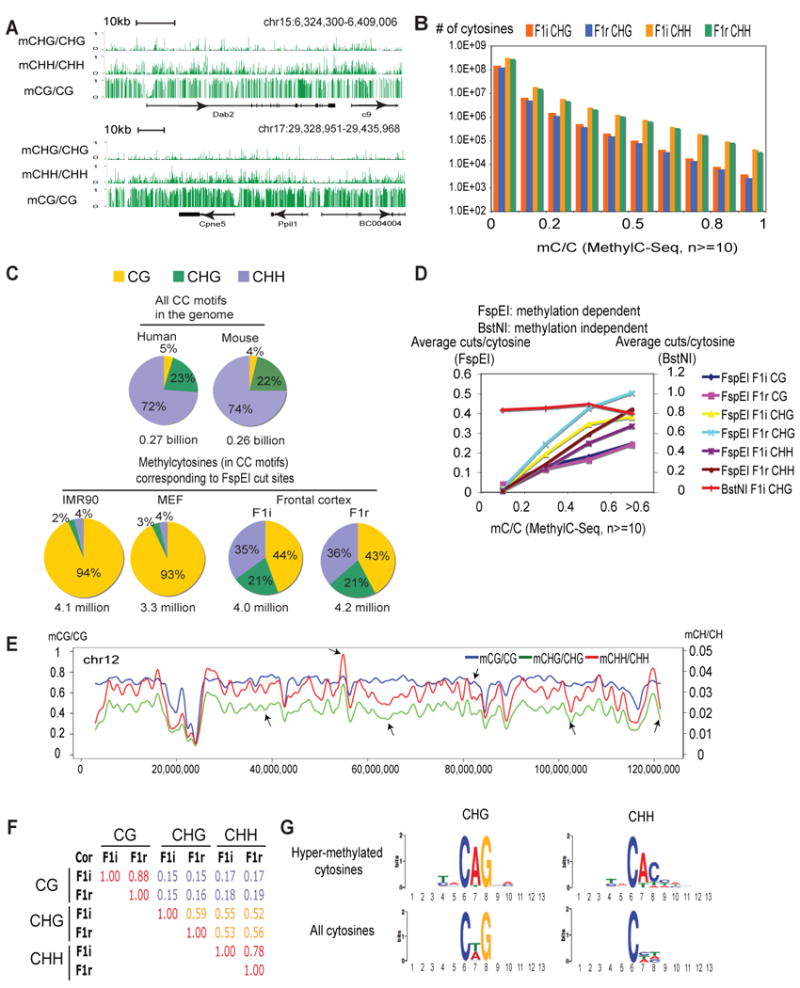
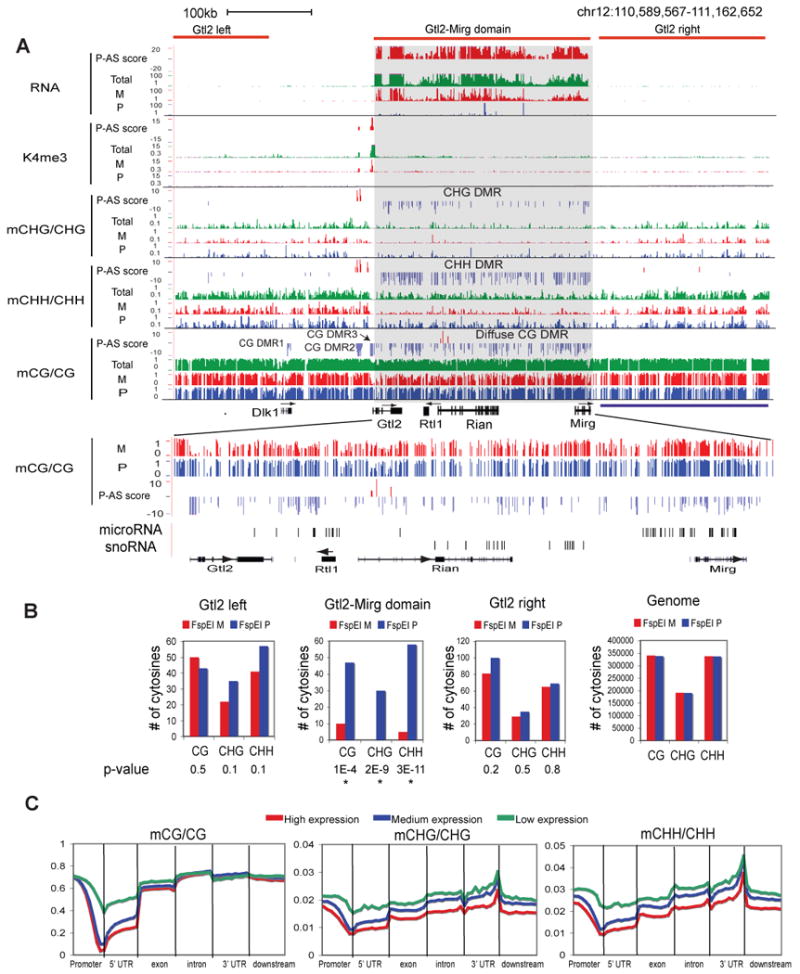
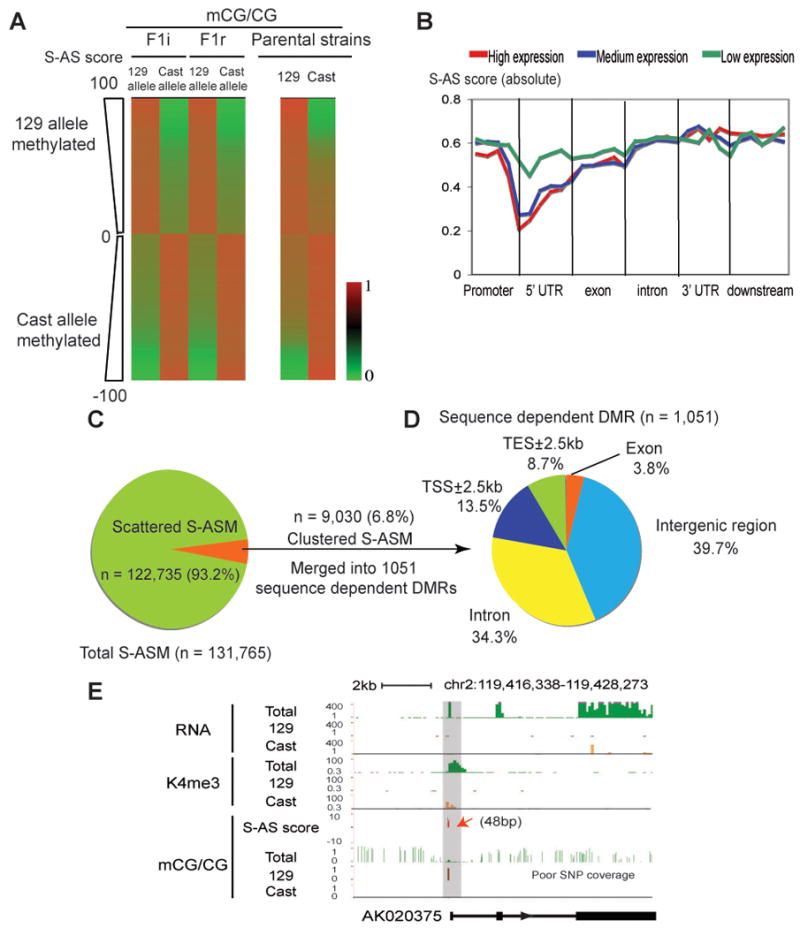
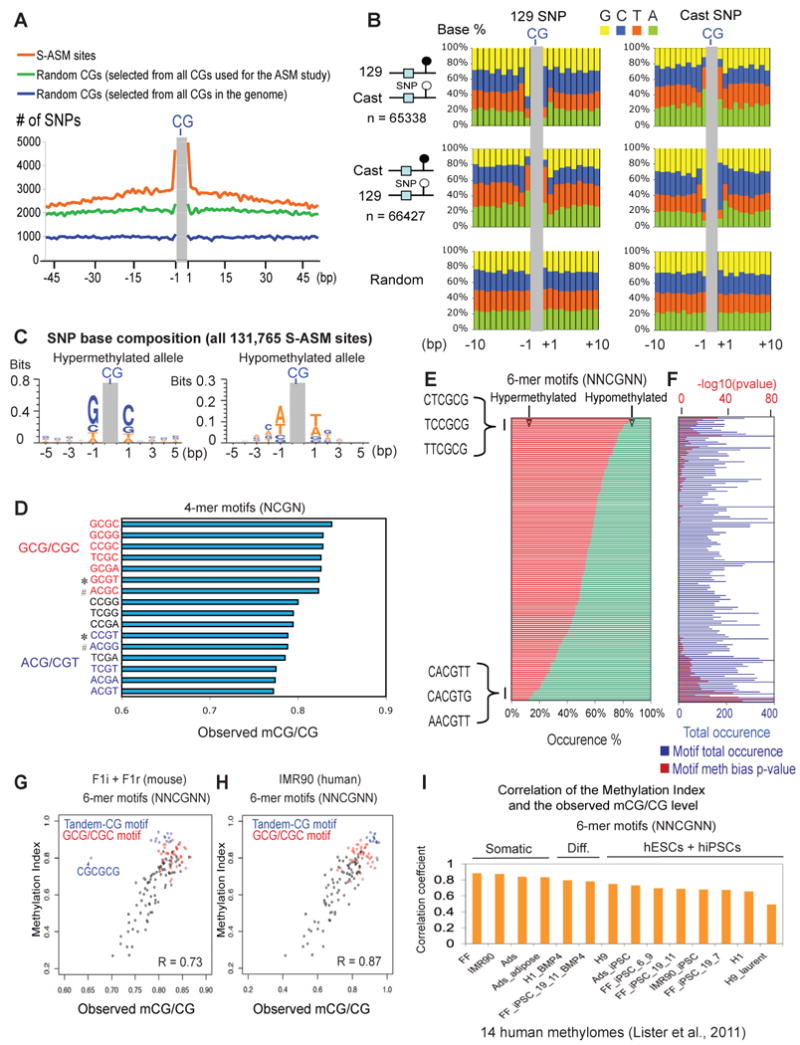
Differential methylation of the two parental genomes in placental mammals is essential for genomic imprinting and embryogenesis. To systematically study this epigenetic process, we have generated a base-resolution, allele-specific DNA methylation (ASM) map in the mouse genome. We find parent-of-origin dependent (imprinted) ASM at 1,952 CG dinucleotides. These imprinted CGs form 55 discrete clusters including virtually all known germline differentially methylated regions (DMRs) and 23 previously unknown DMRs, with some occurring at microRNA genes. We also identify sequence-dependent ASM at 131,765 CGs. Interestingly, methylation at these sites exhibits a strong dependence on the immediate adjacent bases, allowing us to define a conserved sequence preference for the mammalian DNA methylation machinery. Finally, we report a surprising presence of non-CG methylation in the adult mouse brain, with some showing evidence of imprinting. Our results provide a resource for understanding the mechanisms of imprinting and allele-specific gene expression in mammalian cells.


Figures

Figure 1
Figure 1. Genome-wide base-resolution identification of ASM in the mouse frontal cortex
(A) The methylome sequencing depths for F1i and F1r, and the number of SNPs between the parental 129 and Cast genomes are shown. (B) A pie-chart showing the percentages of total methylcytosine events that occur in the contexts of CG, CHG and CHH for F1i (the first numbers) and F1r (the second numbers). Numbers of methylcytosine events resulting from bisulfite conversion failure (based on the conversion rate) were subtracted from the total numbers of methylcytosine events for CGs, CHGs and CHHs. (C) A pie-chart showing the percentages of MethylC-Seq reads assigned to their parental origins for F1i (the first numbers) and F1r (the second numbers). (D) The percentages of cytosines in the mouse genome covered by at least one read from both alleles are shown as bar graphs for F1i (orange) and F1r (blue). (E) The Fisher's exact test was used to identify parent-of-origin and sequence dependent ASM (top). The genomic distributions are shown for the identified ASM events (middle) or all CGs subjected to the Fisher's exact test (bottom). TSS, transcription start site; TES, transcription end site. (F) A chromosome-wide (chr7) view of AS scores for parent-of-origin dependent ASM (P-AS score; red, maternally methylated (M); blue, paternally methylated (P)) and sequence dependent ASM (S-AS score; dark brown, the 129 allele methylated (129); light brown, the Cast allele methylated (Cast)). A control track shows AS scores by assigning reads randomly to two arbitrary alleles (R-AS score; black). (G) A zoomed-in view of (F) for a region near imprinted genes Peg3 and Usp29 (top). The CG methylation levels (data from both strands combined; green, total; red, maternal; blue, paternal) in each strain are also shown (bottom). (H) A zoomed-in view of (F) for a region near Abcc8 showing sequence dependent ASM. A further enlarged region with two sequence dependent ASM sites is shown in (I). See also Figure S1.
Figure 2
Figure 2. Identification of known and novel imprinted DMRs in the mouse genome
(A) Total (green) and allelic (red, maternal; blue, paternal) levels of RNA, K4me3, K27ac (RPKM values) and CG methylation, together with their P-AS scores, are shown for a region containing Peg3 and Usp29. The ChIP-Seq data were input-normalized. The shade denotes the approximate area harboring the identified DMR in this study. (B) A similar graph as (A) is shown for a region containing Ndn, Magel2, Mkrn3 and Peg12 with DMRs shaded. A novel DMR (red arrow) and a region with poor SNP coverage (blue arrow) are indicated. (C) A similar graph as (A) is shown for a region containing a microRNA gene cluster (mir344). DMRs, K27ac and K4me3 peaks that co-localize with microRNA genes (shaded) are indicated by red arrows, “*” and “+”, respectively. See also Figure S3.
Figure 3
Figure 3. Non-CG methylation is present in the mouse frontal cortex
(A) The methylation levels for CHG, CHH and CG are shown near two examples of genomic loci (pooled data from F1i and F1r, coverage ≥10). For simplicity, only data from the forward strand are shown for non-CG methylation. (B) The numbers of cytosines (coverage ≥10) at various methylation levels are shown as bar graphs for CHG and CHH in F1i and F1r. (C) The percentages of CGs, CHGs and CHHs corresponding to FspEI cut sites in IMR90, MEF, F1i and F1r are plotted as pie-charts. The percentages of CGs, CHGs and CHHs in the CC motif (the second cytosine) in the mouse and human genomes are also shown. (D) The average numbers of FspEI or BstNI cuts per recognized cytosine are plotted against the cytosine methylation levels determined by MethylC-Seq. BstNI recognizes CCWGG (W=A or T) where the second cytosine in the CHG context shows abundant methylation in the mouse cortex (data not shown). (E) A chromosome view (chr12) of CG (blue), CHG (green) and CHH (red) methylation levels (10-kb window). Arrows indicate regions where CG and non-CG methylation show different distributions. (F) Pearson correlation coefficients are shown for pairwise comparison of CG, CHG and CHH methylation levels in F1i and F1r genome wide. (G) Sequence logos are shown for bases proximal to hyper-methylated CHGs (mCHG/CHG ≥ 0.3, coverage ≥ 10) and CHHs (mCHH/CHH ≥ 0.5, coverage ≥ 10). See also Figure S4.
Figure 4
Figure 4. Parent-of-origin dependent non-CG methylation in the mouse frontal cortex
(A) Total and/or allelic levels of RNA, K4me3, CHG methylation, CHH methylation and CG methylation, together with their P-AS scores, are shown for the Dlk1-Gtl2-Mirg domain (top). CG DMRs (DMR1-3 and the diffuse CG DMR) and non-CG DMRs are indicated. A zoomed-in region for the Gtl2-Mirg domain is shown with the locations of microRNA and snoRNA genes indicated (bottom). (B) The numbers of CGs, CHGs and CHHs corresponding to FspEI cut sites on the maternal and paternal alleles in the Gtl2 domain, two regions nearby (“Gtl2-left” and “Gtl2-right”) or the entire genome are shown as bar graphs. The p-values for the allelic bias (binomial distribution) are also shown (“*”, p-value < 0.01). (C) The average methylation levels for CG, CHG and CHH are shown along the promoter (2.5kb upstream of TSSs), 5′UTR, exon, intron, 3′UTR and downstream regions (2.5kb downstream of TESs), for all RefSeq genes with high (top 1/3, red), medium (middle 1/3, blue) and low (bottom 1/3, green) levels of expression (FPKM values, average of F1i and F1r). See also Figure S5.
Figure 5
Figure 5. Genome-wide localization of sequence dependent ASM
(A) The CG methylation levels of the sequence dependent ASM sites (ranked by the S-AS scores) are shown for the 129 allele and Cast allele for F1i and F1r (left). The methylation levels for the same CG sites in the parental 129 and Cast strains (coverage ≥10) are also shown (right). (B) The average S-AS scores (absolute value) are shown along the promoter (2.5kb upstream of TSSs), 5′UTR, exon, intron, 3′UTR and downstream regions (2.5kb downstream of TESs) for all RefSeq genes with high (top 1/3, red), medium (middle 1/3, blue) and low (bottom 1/3, green) levels of expression. (C) The percentages of scattered and clustered sequence dependent ASM sites are shown in a pie chart. (D) Genomic distribution of sequence dependent DMRs (median length = 1,010bp) is shown in a pie chart. (E) An example gene AK020375 shows the 129 allele specific promoter CG methylation (red arrow) and the Cast allele specific K4me3 enrichment and transcription. A region with poor SNP coverage is indicated. See also Figure S6.
Figure 6
Figure 6. Sequence dependent ASM reveals sequence determinants of DNA methylation
(A) The total number of SNPs at each base within +/- 50bp of 131,765 sequence dependent ASM sites (orange) is shown. A similar plot is shown for 131,765 random CG sites drawn from either all CGs selected for the ASM study (green) or all CGs in the whole genome (blue). (B) The SNP base composition on the 129 (left) or the Cast (right) allele is shown for those near ASM sites that are preferentially methylated on the 129 allele (top) or the Cast allele (middle). A similar analysis was done for a control set of random CGs of equal size drawn from all CGs selected for the ASM study (bottom). (C) The base composition for SNPs on the hyper- (left) or hypo- (right) methylated alleles near all sequence-dependent ASM sites is shown as a sequence logo. (D) The median methylation levels of various 4-mer CG motifs (“Observed mCG/CG”) across the frontal cortex genome (excluding the promoters and CGIs) are shown. Motifs that contain GCG/CGC or ACG/CGT signatures are in red or blue, respectively. Examples of motif pairs (marked by “*” or “#”) with similar GC content but with distinct methylation levels are indicated. (E) The percentages of occurrences on hyper- (red) and hypo- (green) methylated alleles are shown for each 6-mer CG motif. (F) The number of total occurrences on both alleles (blue bars, with the scale at the bottom) and the p-value (binomial test, after Bonferroni multiple test correction) reflecting allele occurrence bias (red bars, with the scale at the top) for each motif in (E) are shown. (G) A scatter plot is shown for various 6-mer CG motifs comparing the Methylation Indexes to the median methylation levels across the frontal cortex genome. Motifs with tandem CGs (blue) or GCG/CGC signatures (red) are indicated. R, the Pearson correlation coefficient. (H) A similar plot as (G) is shown for various 6-mer CG motifs comparing the Methylation Indexes derived from mice to the median methylation levels across the genome of IMR90 (Lister et al., 2011). (I) The Pearson correlation coefficients are shown comparing the Methylation Indexes derived from mice to the median methylation levels across the genomes of 14 human lines (Lister et al., 2011) for various 6-mer CG motifs. See also Figure S7.

References

    1. Avila L, Yuen RK, Diego-Alvarez D, Penaherrera MS, Jiang R, Robinson WP. Evaluating DNA methylation and gene expression variability in the human term placenta. Placenta. 2010;31:1070–1077. - PubMed
    1. Babak T, Deveale B, Armour C, Raymond C, Cleary MA, van der Kooy D, Johnson JM, Lim LP. Global survey of genomic imprinting by transcriptome sequencing. Curr Biol. 2008;18:1735–1741. - PubMed
    1. Bartolomei MS, Ferguson-Smith AC. Mammalian Genomic Imprinting. Cold Spring Harb Perspect Biol 2011 - PMC - PubMed
    1. Bird A. DNA methylation patterns and epigenetic memory. Genes & development. 2002;16:6–21. - PubMed
    1. Chedin F, Lieber MR, Hsieh CL. The DNA methyltransferase-like protein DNMT3L stimulates de novo methylation by Dnmt3a. Proc Natl Acad Sci U S A. 2002;99:16916–16921. - PMC - PubMed

Publication types