. 2012 Mar 2;148(5):908-21.
doi: 10.1016/j.cell.2012.02.002. Epub 2012 Feb 16.

Spatial organization of the mouse genome and its role in recurrent chromosomal translocations

Affiliations

Spatial organization of the mouse genome and its role in recurrent chromosomal translocations

Yu Zhang et al. Cell. .

Abstract

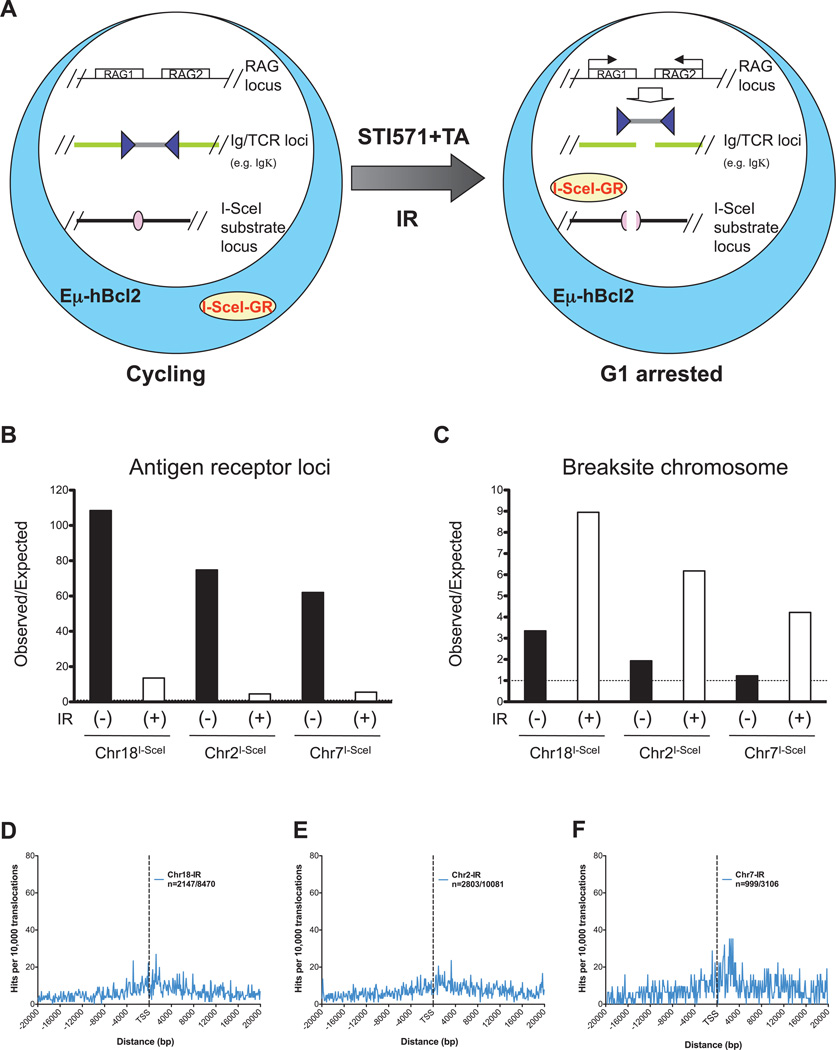
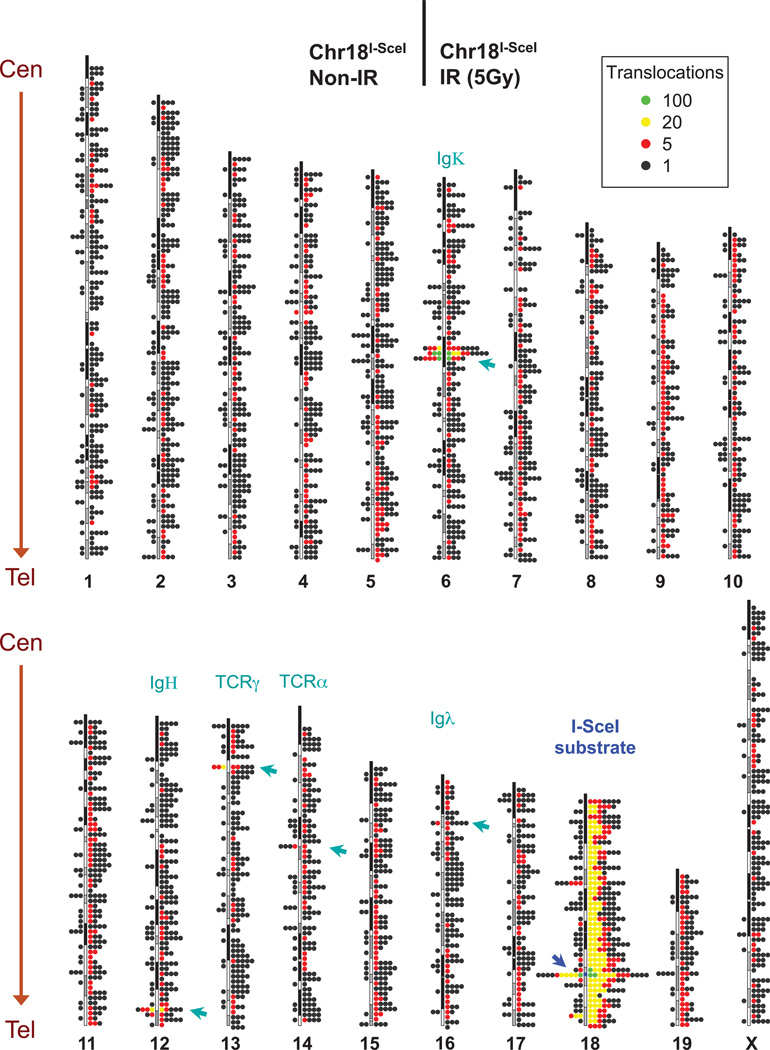
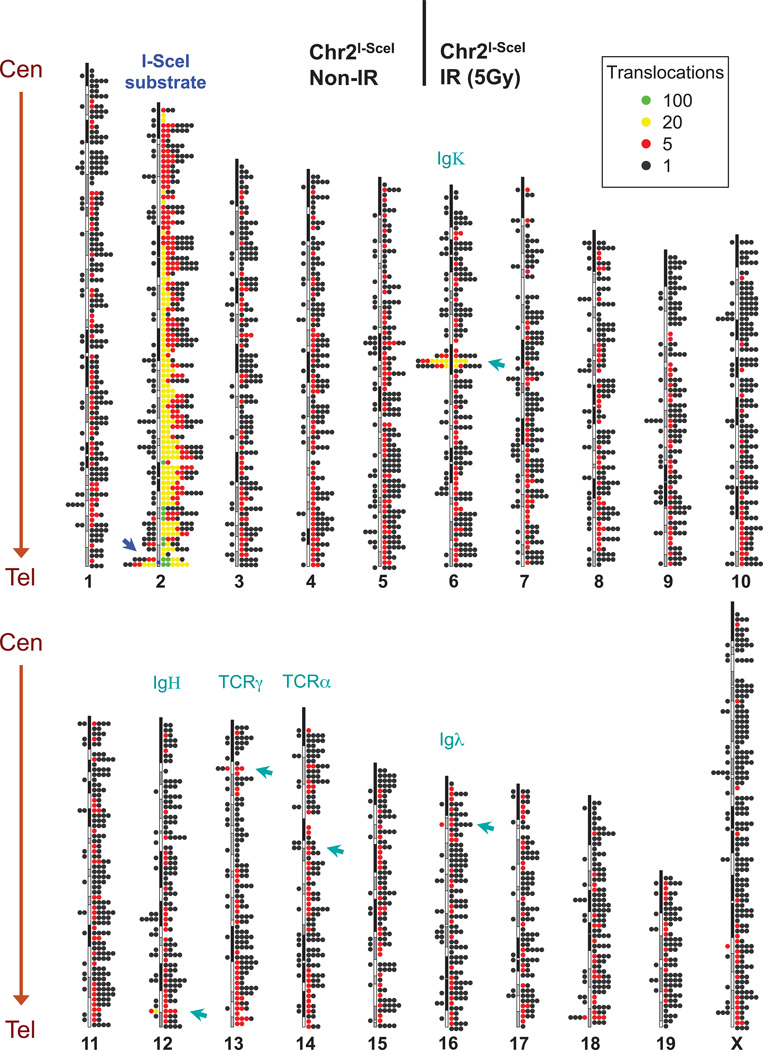
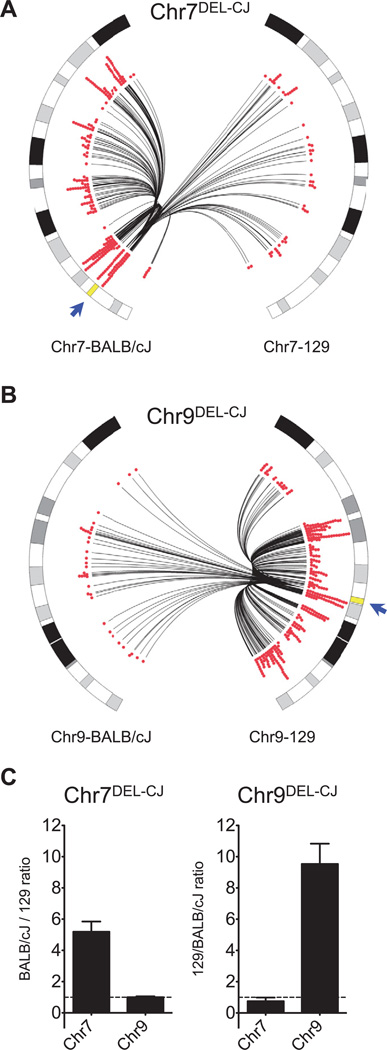
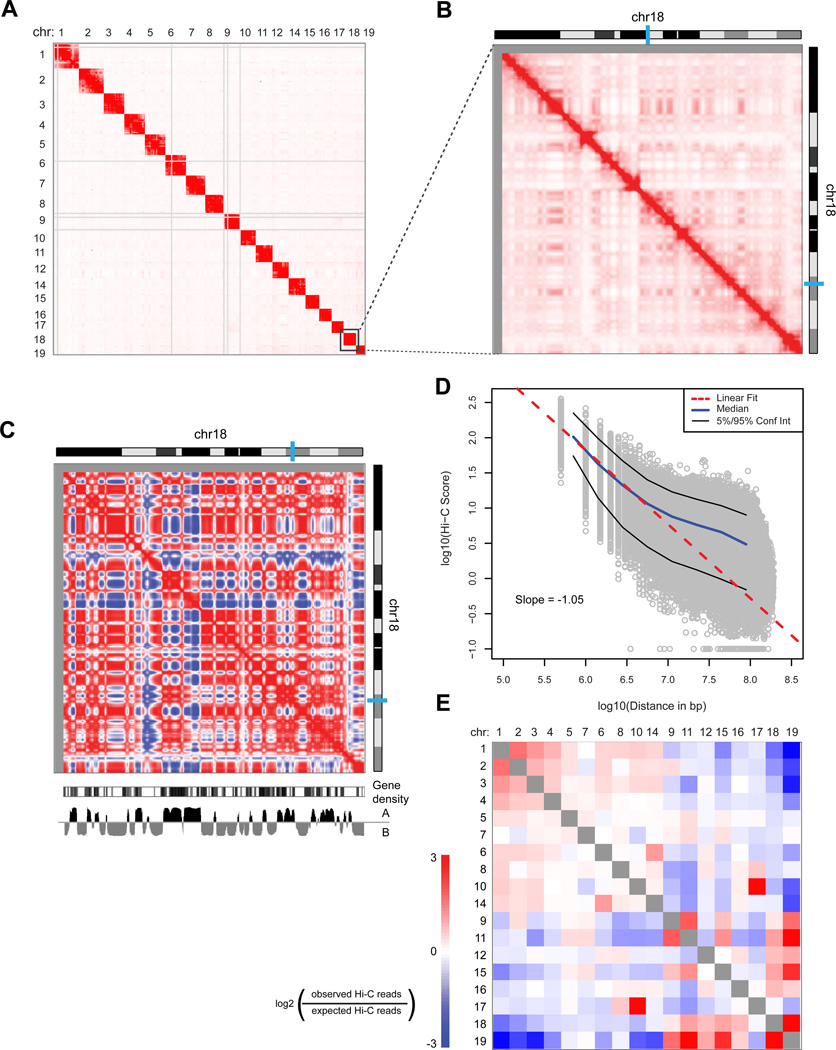
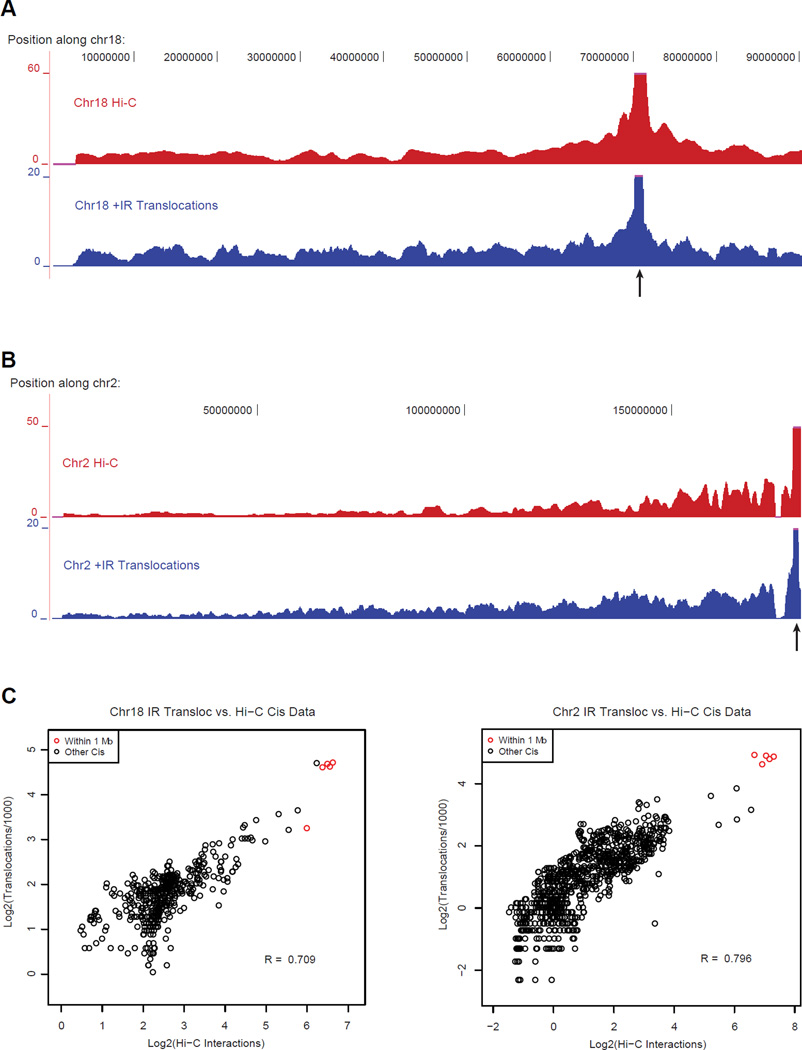
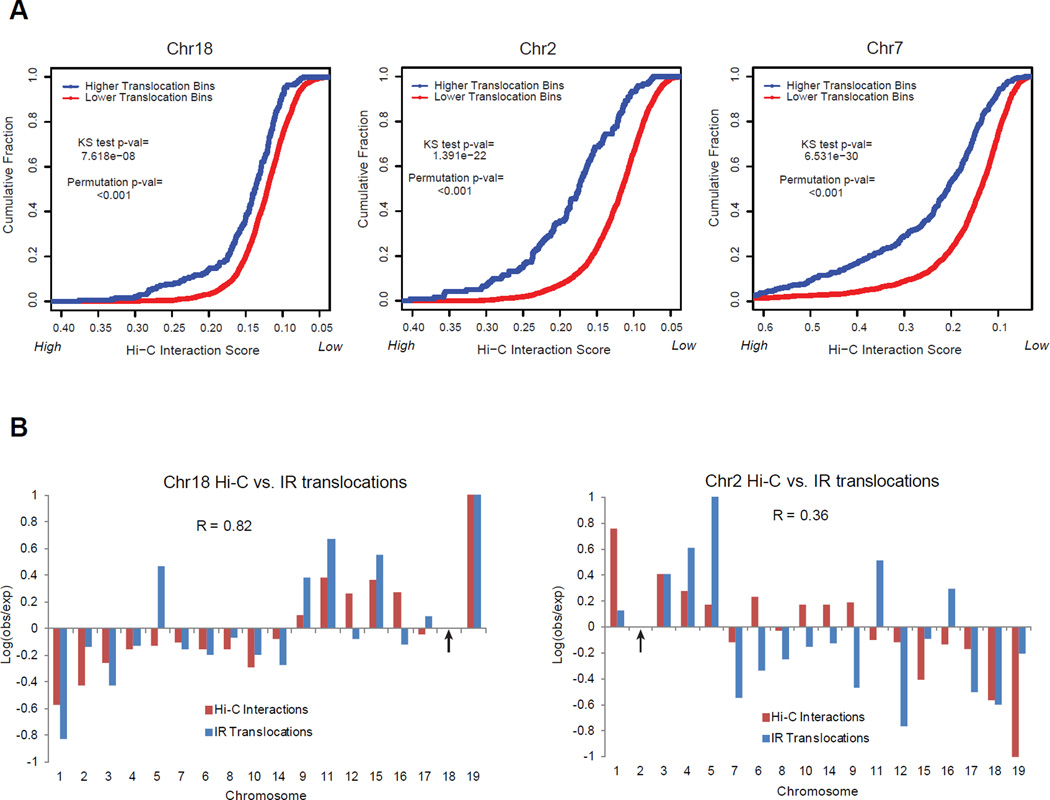
The extent to which the three-dimensional organization of the genome contributes to chromosomal translocations is an important question in cancer genomics. We generated a high-resolution Hi-C spatial organization map of the G1-arrested mouse pro-B cell genome and used high-throughput genome-wide translocation sequencing to map translocations from target DNA double-strand breaks (DSBs) within it. RAG endonuclease-cleaved antigen-receptor loci are dominant translocation partners for target DSBs regardless of genomic position, reflecting high-frequency DSBs at these loci and their colocalization in a fraction of cells. To directly assess spatial proximity contributions, we normalized genomic DSBs via ionizing radiation. Under these conditions, translocations were highly enriched in cis along single chromosomes containing target DSBs and within other chromosomes and subchromosomal domains in a manner directly related to pre-existing spatial proximity. By combining two high-throughput genomic methods in a genetically tractable system, we provide a new lens for viewing cancer genomes.


Figures

Figure 1
Figure 1. HTGTS to study the role of genome organization in promoting translocations
A) Treatment of cycling A-MuLV transformed pro-B lines with STI 571 leads to G1 cell cycle arrest, RAG activation and V(D)J recombination at Igκ. Treatment with TA (triamcinolone acetonide) leads to translocation of I-SceI-GR into the nucleus. Expression of a Bcl-2 transgene prevents apoptosis. Treatment of cells with 5Gy IR introduces random DSBs. B) Dominant RAG-initiated antigen receptor locus translocations. The observed/expected ratios of translocations within 5 antigen receptor loci (Igκ, IgΗ, Igλ, TCRγ, and TCRα) is shown for I-Sce-I targets on chr18, chr2, and chr7 based on pooled HTGTS data from Table S1. Filled bars represent values from indicated cells not treated with IR and open bars represent values from cells treated with 5Gy IR. C) Dominant occurrence of translocations in I-SceI breaksite chromosome. After breaksite proximal junctions (±1Mb) were removed, observed/expected ratios of translocations (pooled data from Table S1) on breaksite chromosomes for different clones (i.e. chr18, chr2, and chr7, respectively) are shown. Filled bars represent samples from cells not IR-treated, while open bars represent samples from cells treated with 5Gy IR. D–F) Genome-wide distribution of translocations relative to TSSs. Junctions from I-SceI targets on chr2(D), chr7 (E), and chr18 (F) upon IR treatment are assigned a distance to the nearest TSS. Breaksite proximal junctions (±1Mb) as well as antigen receptor locus and two chr18 hotspots were removed. Translocation junctions are binned at 100 bp intervals. "n" represents the number of junctions within 20 kb of TSS. See also Fig. S1.
Figure 2
Figure 2. Genome-wide distribution of translocations from Chr18 I-SceI breaksite
Genome-wide map of translocations from the I-SceI cassette in chr18 (labeled by blue arrow) in A-MuLV transformed ATM−/− pro-B cells. The genome was divided into 2Mb bins and the number of unique translocations within each bin represented by colored dots with a black dot indicating one translocation, a red dot 5, a yellow dot 20 and a green dot 100, respectively. Junctions from STI571 and TA treated cells are plotted on left side of each chromosome ideogram, while translocations from STI571, TA, and 5Gy IR-treated cells are plotted on right side. Ig/TCR hotspots are indicated by green arrows. Centromere (Cen) and telomere (Tel) positions are indicated. Data are from pooled HTGTS libraries. See also Fig. S2.
Figure 3
Figure 3. Genome-wide distribution of translocations from Chr2 I-SceI breaksite
Genome-wide map of translocations originating from the I-SceI cassette in chr2, labeled by blue arrow, from A-MuLV transformed ATM−/− mouse pro-B cells. Other details are as for Fig. 2. See also Fig. S3.
Figure 4
Figure 4. Allele specific distribution of chromosomal translocations in F1 A-MuLV Transformants
A, B) V(D)J recombination substrates ("DEL-CJ") were integrated into 129/BALB/cJ pro-B genome within chr7 BALB/cJ allele in one line (A; "Chr7DEL-CJ") and the chr9 129 allele in a different line (B; "Chr9DEL-CJ"). Translocation libraries from the V(D)J substrates were generated by HTGTS and translocations were mapped to the BALB/cJ versus 129 alleles based on available SNPs. The circos plots show the distribution of allelic specific junctions within the two copies of chr7 (A) and the two copies of chr9 (B) for the Chr7DEL-CJ and Chr9DEL-CJ lines, respectively. Individual translocations are represented as arcs originating from I-SceI DSBs and terminating at the partner site in BALB/cJ (left) or 129 (right) chromosomes. The 2 Mb chromosomal region spanning substrate integration sites was omitted from analyses. C) Bar graphs show the relative allelic distribution of translocations on the BALB/cJ and 129 derived chromosomes 7 and 9 for V(D)J recombination substrates integrated into chr7 and chr9. The 2 Mb chromosomal region spanning the substrate integration site was omitted from analyses. See also Fig. S4.
Figure 5
Figure 5. Hi-C analysis of G1 arrested mouse pro-B cell genome spatial organization
A) Heatmap representing the genome-wide chromatin interaction map at 10 Mb resolution. Color intensity indicates the corrected number of Hi-C sequencing reads from each pair of interacting fragments. Regions with many large restriction fragments (>100 kb) or no uniquely mapped reads are shown in gray. B) Higher resolution map (1 Mb bins smoothed with a 200 kb step size) of intra-chromosomal interactions along chr18. C) Correlation map of chr18 at 1 Mb resolution shows chromosome compartmentalization. The first principal component eigenvector (below heatmap: “A” and “B” refer to active and inactive chromatin states) identifies compartments and correlates with gene density. D) In log space, the number of Hi-C contacts between two genomic loci scales linearly with the genomic distance separating the loci. The slope of −1 indicates a fractal globule polymer organization, and is observed for loci separated by 0.5 to at least 5 Mb. E) Observed/expected number of contacts between all pairs of whole chromosomes (sorted by length). Red indicates enrichment; blue indicates depletion. Chr13 is excluded due to a pre-existing translocation. All Hi-C data result from pooling all reads from 5 replicate experiments shown in Fig S5. Cell lines were A-MuLV transformed ATM−/− mouse pro-B cell lines arrested in G1 by STI571 treatment for 2 days. See Fig. S5 for WT results.
Figure 6
Figure 6. Spatial proximity correlates with translocation frequency along the chromosome containing the targeted I-SceI break
A) Top: Hi-C interactions between the 1 Mb bin containing the I-SceI site and other loci along the same chromosome (chr18; 1 Mb bins, 200 kb step). Bottom: Translocation frequency along chr18 after IR (1 Mb bins, 200 kb step). Arrow indicates I-SceI integration site. Some peak heights extend beyond the range shown (pink lines). B) Same graphs as A) for cells with the I-SceI site in chr2. C) Log-log plot of post-IR translocation frequency vs. Hi-C interaction frequency in each 1 Mb bin along chr18 for the chr18 I-SceI integration site (left) or chr2 for the chr2 I-SceI integration site (right). Translocation counts are normalized by the total number of translocations in the dataset, and Hi-C counts are corrected for coverage as described in the Extended Experimental Procedures. Pearson correlations (“R”) are shown. Points located within 1 Mb of the I-SceI site (red) are excluded from the correlation calculation. Similar results were obtained for the chr 7 integration site (Fig. S6).
Figure 7
Figure 7. Translocations between chromosomes or sub-chromosomal regions are correlated with their relative spatial proximity
A) Cumulative distributions of Hi-C interaction frequencies are shown for trans chromosome 5 Mb bins that have either “high translocations” (blue; >=2 translocations/1,000 in dataset) or “low translocations” (red; < 2 translocations/1,000 in dataset) with the I-SceI site after irradiation. A 1 Mb fixed bin around the I-SceI site is used. Hi-C scores are displayed from high-to-low. The high translocation bins have significantly higher Hi-C scores than low translocation bins (one-tailed KS test); this difference is significant compared to 1,000 random permutations of the translocation dataset (“Permutation p-val”). This result is valid for a broad range of thresholds (Fig. S7A). B) Different I-SceI targeted break locations (indicated by arrows; left: chr18, right: chr2) display different whole chromosome translocation frequency profiles (blue) that correlate (R = Pearson correlation coefficient) with their different whole chromosome proximity profiles (red). Log ratios of observed/expected translocation frequencies and Hi-C interaction frequencies between whole chromosomes (calculated as in Fig 5E) are normalized to a maximum of 1. Chromosomes are sorted by length. All Ig and TCR hotspot loci are excluded from analyses in A) and B). See also Fig. S7.

References

    1. Barreca A, Lasorsa E, Riera L, Machiorlatti R, Piva R, Ponzoni M, Kwee I, Bertoni F, Piccaluga PP, Pileri SA, et al. Anaplastic lymphoma kinase in human cancer. Journal of molecular endocrinology. 2011;47:R11–R23. - PubMed
    1. Bolzer A, Kreth G, Solovei I, Koehler D, Saracoglu K, Fauth C, Muller S, Eils R, Cremer C, Speicher MR, et al. Three-dimensional maps of all chromosomes in human male fibroblast nuclei and prometaphase rosettes. PLoS biology. 2005;3:e157. - PMC - PubMed
    1. Boyle S, Gilchrist S, Bridger JM, Mahy NL, Ellis JA, Bickmore WA. The spatial organization of human chromosomes within the nuclei of normal and emerin-mutant cells. Human molecular genetics. 2001;10:211–219. - PubMed
    1. Bredemeyer AL, Helmink BA, Innes CL, Calderon B, McGinnis LM, Mahowald GK, Gapud EJ, Walker LM, Collins JB, Weaver BK, et al. DNA double-strand breaks activate a multi-functional genetic program in developing lymphocytes. Nature. 2008;456:819–823. - PMC - PubMed
    1. Bredemeyer AL, Sharma GG, Huang CY, Helmink BA, Walker LM, Khor KC, Nuskey B, Sullivan KE, Pandita TK, Bassing CH, et al. ATM stabilizes DNA double-strand-break complexes during V(D)J recombination. Nature. 2006;442:466–470. - PubMed

Publication types

Substances

Associated data