

Early Alzheimer's disease blocks responses to accelerating self-movement
- PMID: 22341609
- PMCID: PMC3689010
- DOI: 10.1016/j.neurobiolaging.2011.12.031
Early Alzheimer's disease blocks responses to accelerating self-movement
Abstract
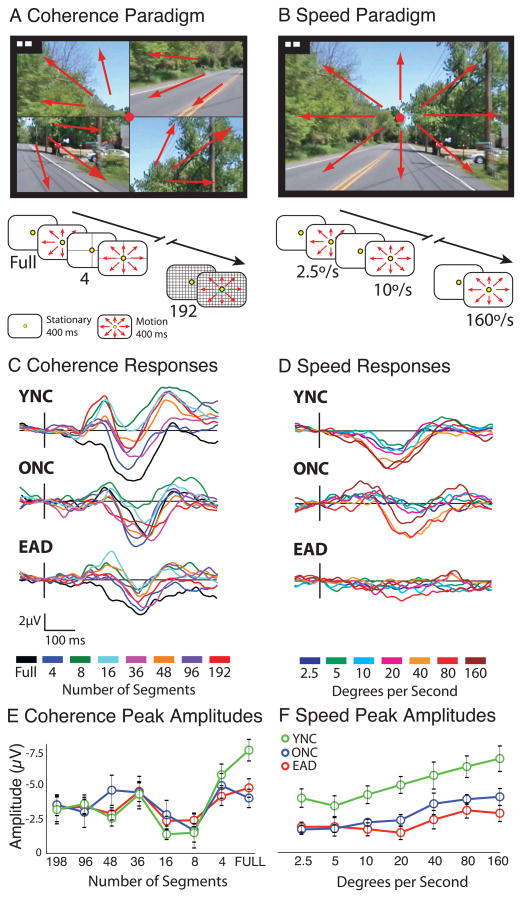
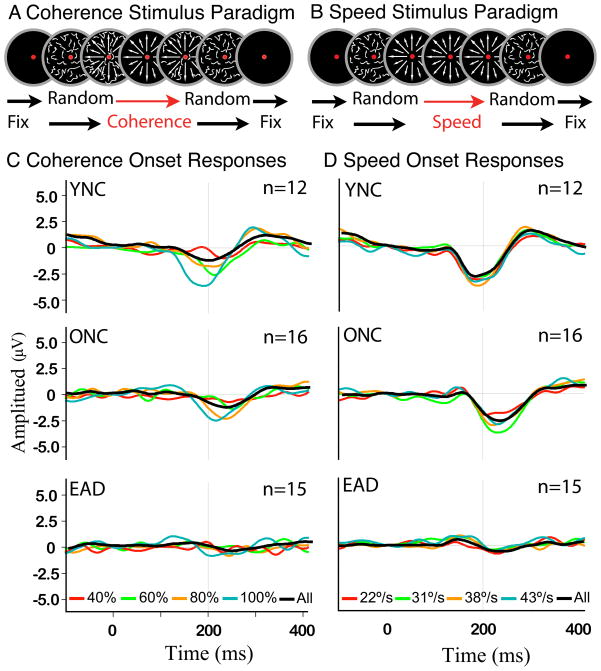
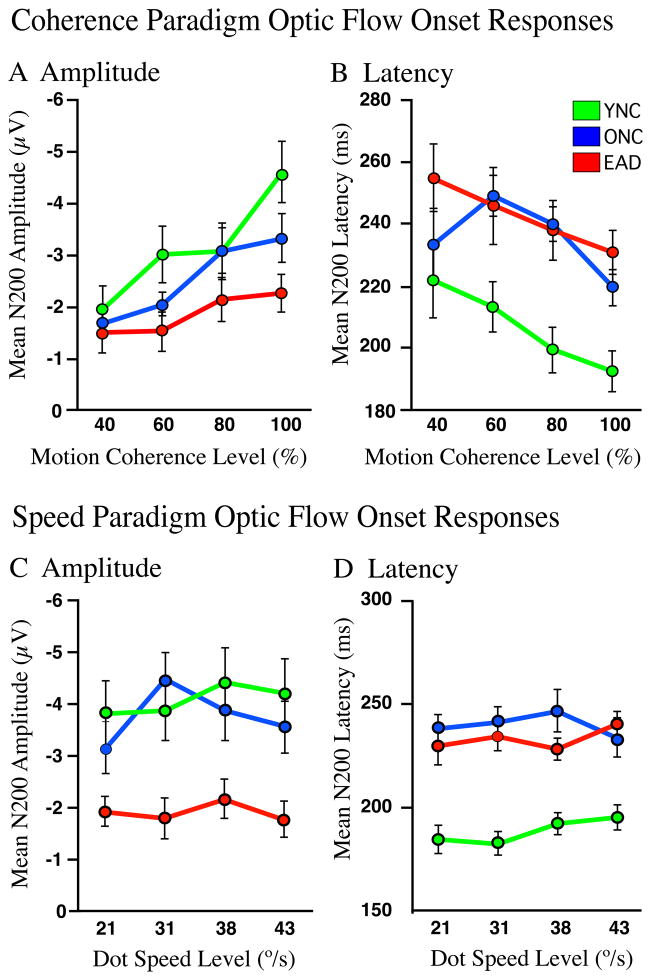
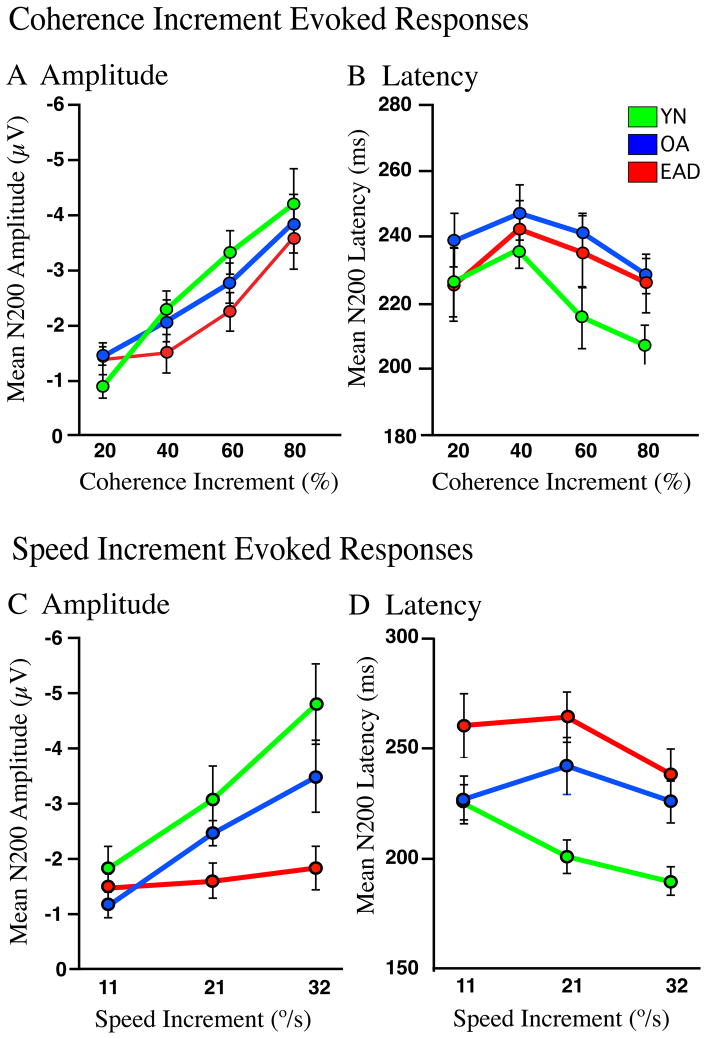
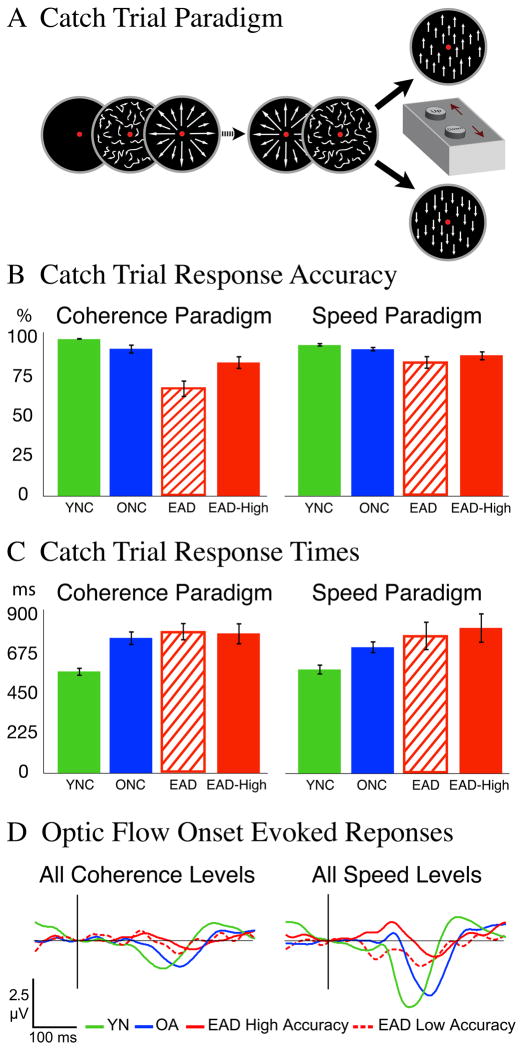
We assessed the cortical processing of self-movement stimuli in aging and Alzheimer's disease (AD). Our goal was to identify distinguishing effects on neural mechanisms related to driving and navigation. Young (YNC) and older (ONC) normal controls, and early AD patients (EAD) viewed real-world videos and dot motion stimuli simulating self-movement scenes. We recorded visual motion event related potentials (VMERPs) to stimulus motion coherence and speed. Aging delays motion evoked N200s, whereas AD diminishes response amplitudes. Early Alzheimer's disease patients respond to increments in motion coherence, but they are uniquely unresponsive to increments in motion speed that simulate accelerating self-movement. AD-related impairments of self-movement processing may have grave consequences for driving safety and navigational independence.
Copyright © 2012 Elsevier Inc. All rights reserved.
Figures
Similar articles
-
Visual motion event related potentials distinguish aging and Alzheimer's disease.J Alzheimers Dis. 2013;36(1):177-83. doi: 10.3233/JAD-122053. J Alzheimers Dis. 2013. PMID: 23594601 Free PMC article.
-
Neurophysiological and perceptual correlates of navigational impairment in Alzheimer's disease.Brain. 2006 Mar;129(Pt 3):736-46. doi: 10.1093/brain/awh727. Epub 2006 Feb 3. Brain. 2006. PMID: 16461482
-
Approaching objects cause confusion in patients with Alzheimer's disease regarding their direction of self-movement.Brain. 2010 Sep;133(9):2690-701. doi: 10.1093/brain/awq140. Epub 2010 Jul 20. Brain. 2010. PMID: 20647265 Free PMC article.
-
Distinct visual motion processing impairments in aging and Alzheimer's disease.Vision Res. 2011 Feb 9;51(3):386-95. doi: 10.1016/j.visres.2010.12.004. Epub 2010 Dec 13. Vision Res. 2011. PMID: 21156185 Free PMC article.
-
Psychophysical correlates of global motion processing in the aging visual system: a critical review.Neurosci Biobehav Rev. 2012 Apr;36(4):1266-72. doi: 10.1016/j.neubiorev.2012.02.009. Epub 2012 Feb 16. Neurosci Biobehav Rev. 2012. PMID: 22343109 Review.
Cited by
-
Hyperexcitability in Aging Is Lost in Alzheimer's: What Is All the Excitement About?Cereb Cortex. 2020 Oct 1;30(11):5874-5884. doi: 10.1093/cercor/bhaa163. Cereb Cortex. 2020. PMID: 32548625 Free PMC article.
-
Peripheral reaching in Alzheimer's disease and mild cognitive impairment.Cortex. 2022 Apr;149:29-43. doi: 10.1016/j.cortex.2022.01.003. Epub 2022 Jan 31. Cortex. 2022. PMID: 35184013 Free PMC article.
-
Driving Ability in Alzheimer Disease Spectrum: Neural Basis, Assessment, and Potential Use of Optic Flow Event-Related Potentials.Front Neurol. 2018 Sep 7;9:750. doi: 10.3389/fneur.2018.00750. eCollection 2018. Front Neurol. 2018. PMID: 30245666 Free PMC article. Review.
-
Might cortical hyper-responsiveness in aging contribute to Alzheimer's disease?PLoS One. 2014 Sep 10;9(9):e105962. doi: 10.1371/journal.pone.0105962. eCollection 2014. PLoS One. 2014. PMID: 25208332 Free PMC article.
-
Driving Assessment for Persons with Dementia: How and when?Aging Dis. 2023 Jun 1;14(3):621-651. doi: 10.14336/AD.2022.1126. Aging Dis. 2023. PMID: 37191415 Free PMC article. Review.
References
-
- Bach M, Ullrich D. Motion adaptation governs the shape of motion-evoked cortical potentials. Vision Res. 1994;34(12):1541–7. - PubMed
-
- Bach M, Ullrich D. Contrast dependency of motion-onset and pattern-reversal VEPs: interaction of stimulus type, recording site and response component. Vision Res. 1997;37(13):1845–9. - PubMed
-
- Bardy BG, Warren WH., Jr Visual control of braking in goal-directed action and sport. J Sports Sci. 1997;15(6):607–20. - PubMed
-
- Becker JT, Huff FJ, Nebes RD, Holland A, Boller F. Neuropsychological function in alzheimer’s disease: Pattern of impairment and rates of progression. Archives of Neurology. 1988;45:263–8. - PubMed
-
- Britten KH, Shadlen MN, Newsome WT, Movshon JA. Responses of neurons in macaque MT to stochastic motion signals. Visual Neuroscience. 1993;10(6):1157–69. - PubMed
Publication types
MeSH terms
Grants and funding
LinkOut - more resources
Full Text Sources
Medical
