. 2012 May 10;426(2):120-33.
doi: 10.1016/j.virol.2012.01.025. Epub 2012 Feb 16.

A role for granulocyte-macrophage colony-stimulating factor in the regulation of CD8(+) T cell responses to rabies virus

Affiliations

A role for granulocyte-macrophage colony-stimulating factor in the regulation of CD8(+) T cell responses to rabies virus

Celestine N Wanjalla et al. Virology. .

Abstract

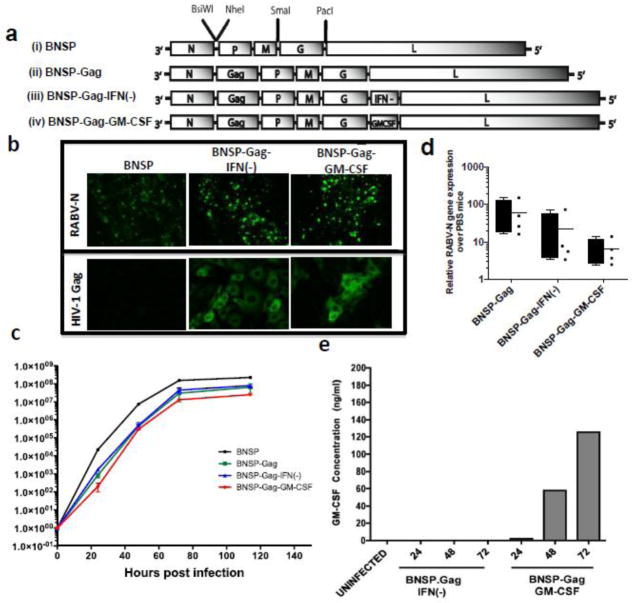
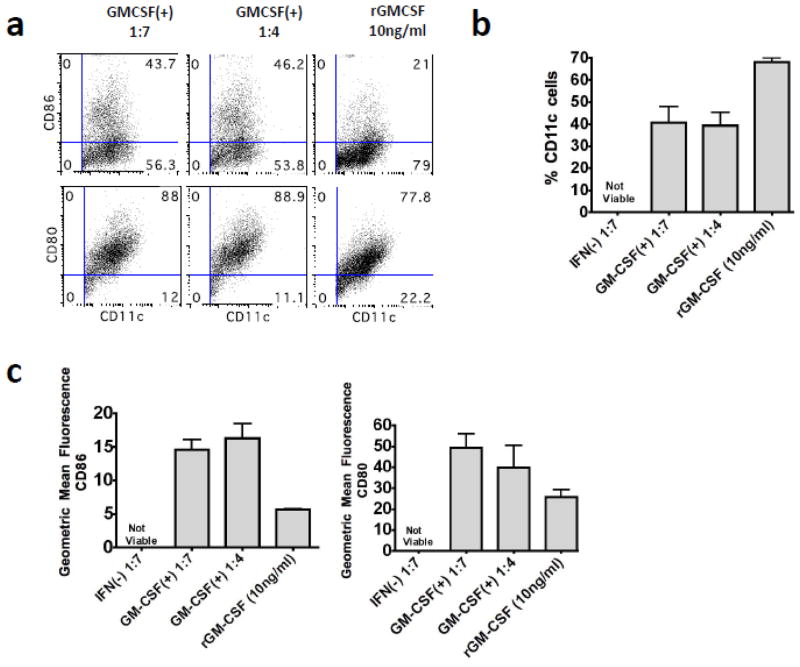
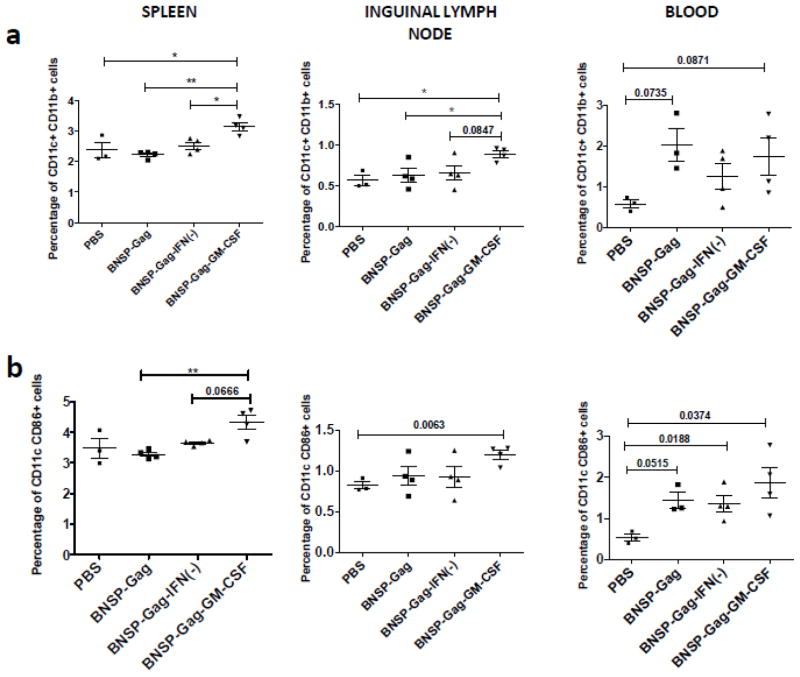
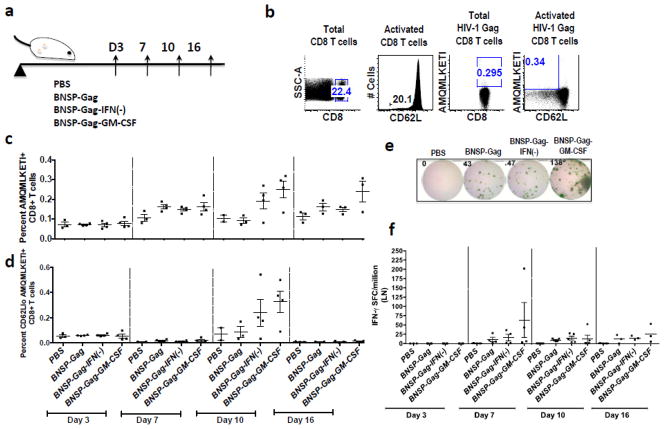
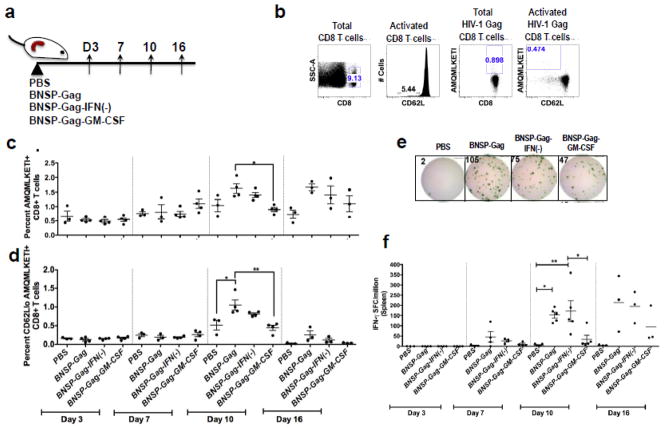
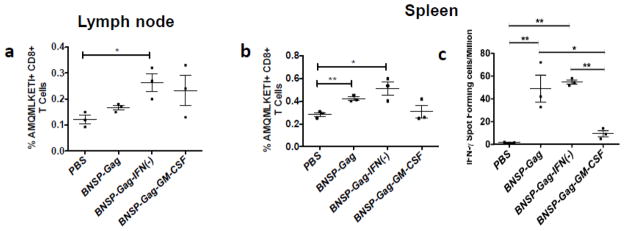
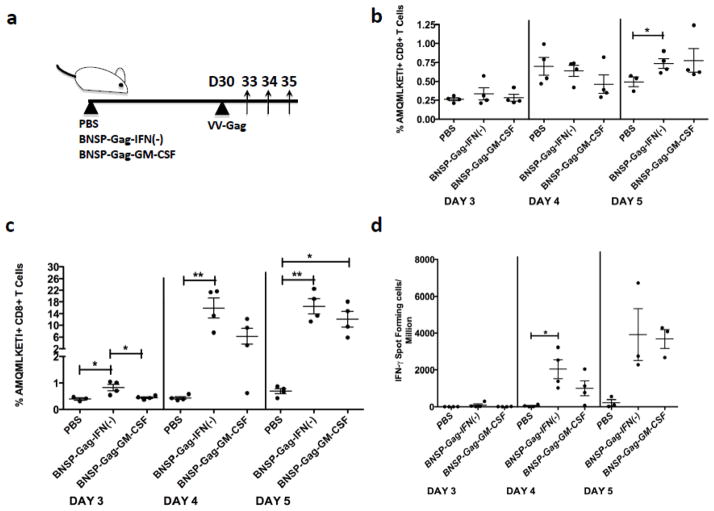
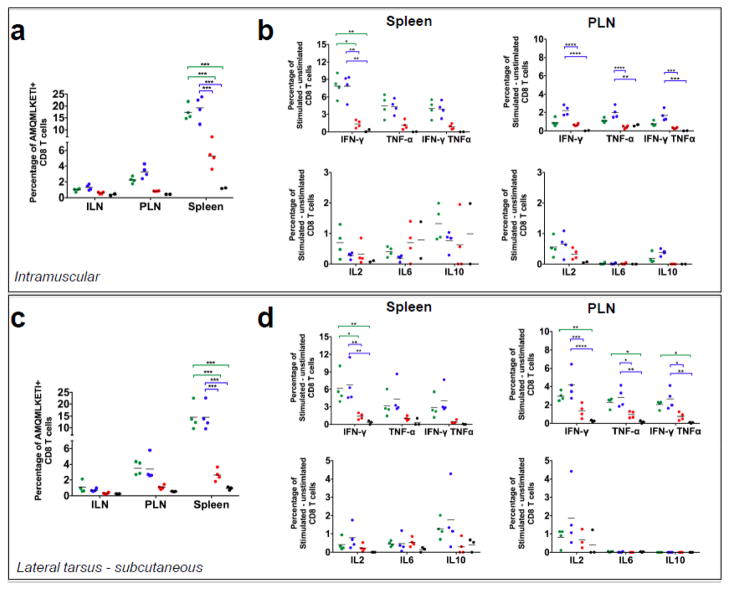
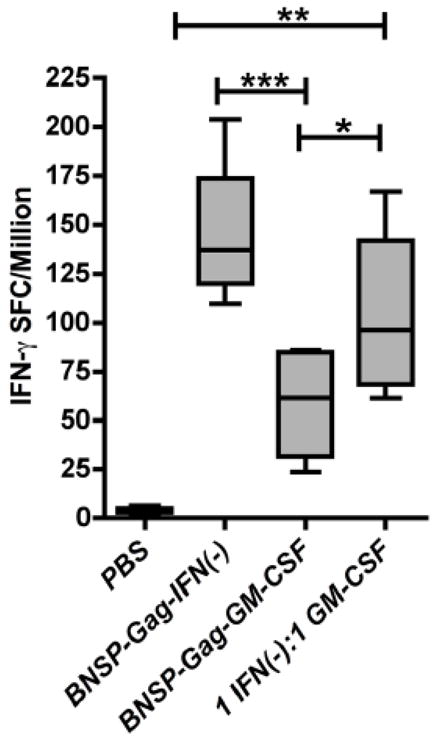
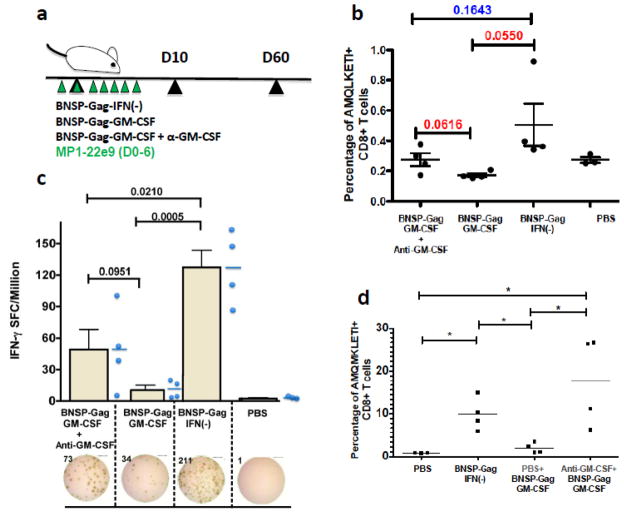
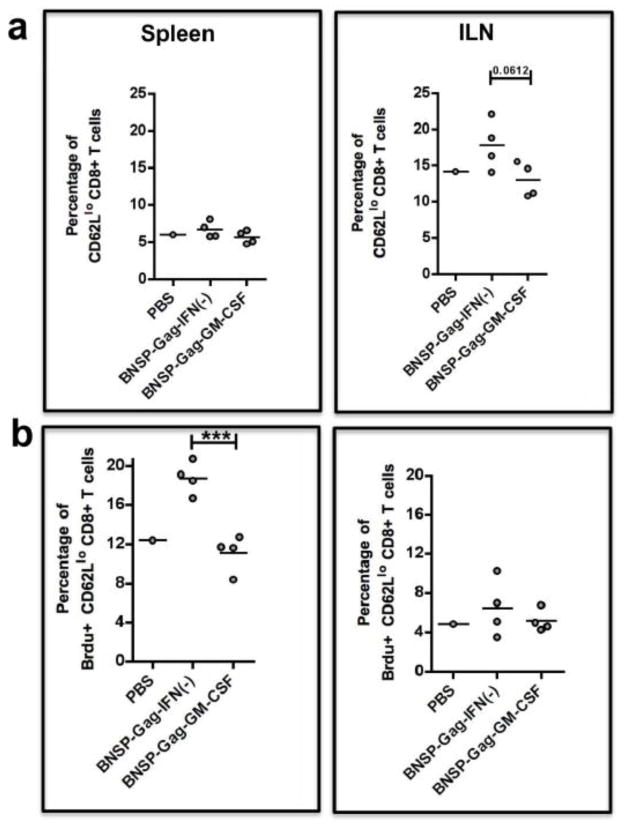
Inflammatory cytokines have a significant role in altering the innate and adaptive arms of immune responses. Here, we analyzed the effect of GM-CSF on a RABV-vaccine vector co-expressing HIV-1 Gag. To this end, we immunized mice with RABV expressing HIV-1 Gag and GM-CSF and analyzed the primary and recall CD8(+) T cell responses. We observed a statistically significant increase in antigen presenting cells (APCs) in the spleen and draining lymph nodes in response to GM-CSF. Despite the increase in APCs, the primary and memory anti HIV-1 CD8(+) T cell response was significantly lower. This was partly likely due to lower levels of proliferation in the spleen. Animals treated with GM-CSF neutralizing antibodies restored the CD8(+) T cell response. These data define a role of GM-CSF expression, in the regulation of the CD8(+) T cell immune responses against RABV and has implications in the use of GM-CSF as a molecular adjuvant in vaccine development.


Figures

Figure 1
Figure 1. Plasmid construction and characterization of viral constructs
The RABV vaccine vectors used throughout this study are illustrated: viruses (i)– (iii) will be used as controls and BNSP-Gag-GM-CSF (iv) is the experimental vaccine being analyzed here (a). BSR cells infected with BNSP, BNSP-Gag-IFN(−) and BNSP-Gag-GM-CSF for 48h were fixed and stained for internal expression of RABV-N and HIV-1 Gag (b). The growth kinetics of the different viruses were monitored on BSR cells after infection at MOI of 0.01 (c). Replication of the viral vectors was also monitored by quantification of RABV-N mRNA in the muscles of immunized mice (n=4 for each group) 3 days post infection (d), GM-CSF expression and secretion was monitored by a quantitative ELISA of supernatants 24, 48 and 72h post infection at an MOI = 10 (e).
Figure 2
Figure 2. BNSP-Gag-GM-CSF expresses biologically functional GM-CSF
To test the biological activity of the secreted GM-CSF, primary bone marrow cells were cultured in media supplemented with either 10ng/ml recombinant GM-CSF or UV-inactivated supernatants from BNSP-Gag-IFN(−) and BNSP-Gag-GMCSF(+) infected BSR cells diluted at 1:7 or 1: 4 in media. After 7-day culture, the cells were harvested and stained with antibodies against CD11c (a–c), CD80 and CD86 (c). The data are representative of two repeat experiments (for a total n=6).
Figure 3
Figure 3. BNSP-Gag-GM-CSF expresses GM-CSF that has physiological effects on DCs in vivo
6–8 week old BALB/c mice were immunized with 1 × 10⁵ FFU of either BNSP-Gag, BNSP-Gag-IFN(−) or BNSP-Gag-GM-CSF. 3 days later the spleens, draining lymph nodes and blood were harvested and stained with antibodies against surface markers of DCs – CD11c and CD11b (a) and activation marker - CD86 and CD11c (b). Statistical analysis was performed using one-WAY ANOVA and Students t-tests. Numerical statistical values were obtained by t-test whereas P values indicated by * were obtained by ONE-WAY ANOVA test. * P <0.05, ** P<0.01.
Figure 4
Figure 4. Analysis of the magnitude of Gag-specific CD8+ T cells in the draining lymph nodes
6–8 week old BALB/c mice were primed with 1 × 10⁵ ffu BNSP-Gag, BNSP-Gag-IFN(−) or BNSP-Gag-GM-CSF. PBS mice were included as a negative control. The draining inguinal lymph nodes were isolated from mice on days 3, 7, 10 and 16 (a). Flow cytometry analysis of CD8+ T cell markers was gated as shown (b). The quantity of Gag-specific cells was measured with a tetramer stain against H2d restricted AMQMKLETI epitope (c). Activated Gag-specific CD8+ T cells were gated on CD62Llo cells (d). To further measure the functionality of the cells, an IFN-γ ELISpot assay was done (e-f). Numerical statistical values were obtained by t-test whereas P values indicated by * were obtained by ONE-WAY ANOVA test.
Figure 5
Figure 5. GM-CSF expression reduces the magnitude of the Gag-Specific CD8+ T cells in the spleen
6–8 week old BALB/c mice were primed with 1 × 10⁵ ffu BNSP-Gag, BNSP-Gag-IFN(−) or BNSP-Gag-GM-CSF. PBS mice were included as a negative control. The spleens were isolated from mice on days 3, 7, 10 and 16 (a). Flow cytometry analysis of CD8+ T cell markers was gated as shown (b). The quantity of Gag-specific cells was measured with a tetramer stain against H2d restricted AMQMKLETI epitope (c). Activated Gag-specific CD8+ T cells were gated on CD62Llo cells (d). To further measure the functionality of the cells, an IFN-γ ELISpot assay was done (e–f). Statistical analysis was performed using one-way ANOVA * P <0.05, ** P<0.01.
Figure 6
Figure 6. Reduction of CD8+ T cells by GM-CSF expression persists into the memory phase
BALB/c mice were immunized im. with 1 × 10⁵ FFU BNSP-Gag, BNSP-Gag-IFN(−) or BNSP-Gag-GM-CSF and rested for 30 days at which point the ILNs and spleen was harvested. Gag-specific CD8+ T cells were quantified by flow cytometry in the draining ILNs (a) and spleen (b). Secretion of IFN-γ by AMQMKLETI peptide pulsed cells was measured in an ELISpot assay (c). Statistical analyses were performed using one-way ANOVA, * P <0.05, ** P<0.01.
Figure 7
Figure 7. Mice challenged i.p. with VV-Gag elicit a recall response proportional to the primary and memory immune profiles in the spleen
Mice immunized with 1 × 10⁵ FFU BNSP-Gag-IFN(−) and BNSP-Gag-GM-CSF were rested for 30 days. Each group was challenged with 1 × 10⁶ FFU VV-Gag and the immune responses analyzed on day 3, 4 and 5 as shown (a). Gag-specific CD8+ T cells in the lymph nodes (b) and spleen (c) were analyzed and presented as a percentage. The functional expression of the CD8+ T cells was further monitored in an IFN-γ ELISpot assay following AMQMKLETI peptide stimulation (d). Statistical analysis was performed using one-way ANOVA, P <0.05, ** P<0.01. The data are representative of three repeat experiments.
Figure 8
Figure 8. Different routes of VV-Gag challenge do not rescue the CD8+ T cell response
BALB/c mice that had been previously immunized with 1 × 10⁵ FFU BNSP-Gag (green dots), BNSP-Gag-IFN(−) (blue dots) and BNSP-Gag-GM-CSF (red dots) were challenged either intramuscularly or subcutaneously with 1 × 10⁶ FFU VV-Gag 40 days post prime. PBS mice (black dots) were included as a negative control. 5 days post challenge, the draining inguinal lymph nodes (ILN), popliteal lymph nodes (PLN) and spleens were harvested and the number of Gag-specific CD8+ T cells measured using AMQMKLETI tetramer staining from both the intramuscular (a) and subcutaneous (c) groups. The quality of the CD8++ T cells was measured by intracellular cytokine staining for inflammatory (IFN- γ, TNF- α, IL-2 and IL-6) and inhibitory (IL-10) cytokines after stimulation of cells with AMQMKLETI peptide (b, d). Statistical analysis was performed using one-way ANOVA, * P <0.05, ** P<0.01, *** P<0.001, **** P<0.0001.
Figure 9
Figure 9. AMQMKLETI specific CD8+ T cell induction after co-immunization with BNSP-Gag-IFN(−) and BNSP-Gag-GM-CSF
BALB/c mice were immunized with 2 × 10⁵ FFU BNSP-Gag-IFN(−), 2 × 10⁵ FFU BNSP-Gag-GM-CSF or 1 × 10⁵ FFU BNSP-Gag-IFN(−) + 1 × 10⁵ FFU BNSP-Gag-GM-CSF. PBS mice were included as a control. The primary immune response was monitored 10 days post prime by analysis of CD8+ CD8+AMQMKLETI-stimulated functional expression of IFN-γ by Gag-specific CD8+ T (a) and IL2 (b) cellswas measured using an ELISpot assays. Statistical analysis was performed using one-way ANOVA * P <0.05, ** P<0.01, *** P<0.001.
Figure 10
Figure 10. Administration of anti-GM-CSF during immunization partially restores the CD8+ T cell response
BALB/c mice were pre-treated with 75ug anti-GM-CSF (MP1-22e9) neutralizing antibody followed by daily treatments for a total of 7 days. The primary immune response was monitored in the mice 10 days post prime (a). Analysis of AMQMKLETI specific CD8+ T cells was measured in the spleens of immunized mice on day 10 of the immune response (b). Functional expression of IFN-γ was measured in an ELISpot assay (c). Secondary Gag-specific CD8+ T cell responses were monitored after 5 days post i.p. challenge with VV-Gag (d). Statistical analysis was performed using Students t-tests. Numerical statistical values (P) are indicated on the graphs and * P <0.05.
Figure 11
Figure 11. Brdu proliferation assay on activated CD8+ T cells
BALB/c mice were immunized with 1 × 10⁵FFU BNSP-Gag-IFN(−) or BNSP-Gag-GM-CSF. One PBS mouse was added as a control. Three days post prime, the mice were injected i.p. with 2mg BrdU. For the following three days, the mice were given BrdU (0.8mg/ml) in their water. The spleens and ILNs were isolated from the mice 7 days post prime. Activated CD62Llo CD8+ T cells were measured by flow cytometry (a). BrdU positive cells among the CD62Llo CD8+ T cells are shown (b). Statistical analysis was performed using one-way ANOVA, * P <0.05, *** P<0.001.

Similar articles

Cited by

References

    1. Borrow P, Lewicki H, Hahn BH, Shaw GM, Oldstone MB. Virus-specific CD8+ cytotoxic T-lymphocyte activity associated with control of viremia in primary human immunodeficiency virus type 1 infection. J Virol. 1994;68:6103–6110. - PMC - PubMed
    1. Brode S, Macary PA. Cross-presentation: dendritic cells and macrophages bite off more than they can chew! Immunology. 2004;112:345–351. - PMC - PubMed
    1. Bronte V, Apolloni E, Cabrelle A, Ronca R, Serafini P, Zamboni P, Restifo NP, Zanovello P. Identification of a CD11b(+)/Gr-1(+)/CD31(+) myeloid progenitor capable of activating or suppressing CD8(+) T cells. Blood. 2000;96:3838–3846. - PMC - PubMed
    1. Bukreyev A, Belyakov IM, Berzofsky JA, Murphy BR, Collins PL. Granulocyte-macrophage colony-stimulating factor expressed by recombinant respiratory syncytial virus attenuates viral replication and increases the level of pulmonary antigen-presenting cells. J Virol. 2001;75:12128–12140. - PMC - PubMed
    1. Burgess AW, Camakaris J, Metcalf D. Purification and properties of colony-stimulating factor from mouse lung-conditioned medium. J Biol Chem. 1977;252:1998–2003. - PubMed

Publication types

MeSH terms

Substances