

Genome-wide association study of three-dimensional facial morphology identifies a variant in PAX3 associated with nasion position
- PMID: 22341974
- PMCID: PMC3309180
- DOI: 10.1016/j.ajhg.2011.12.021
Genome-wide association study of three-dimensional facial morphology identifies a variant in PAX3 associated with nasion position
Abstract
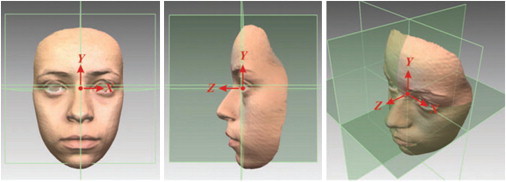
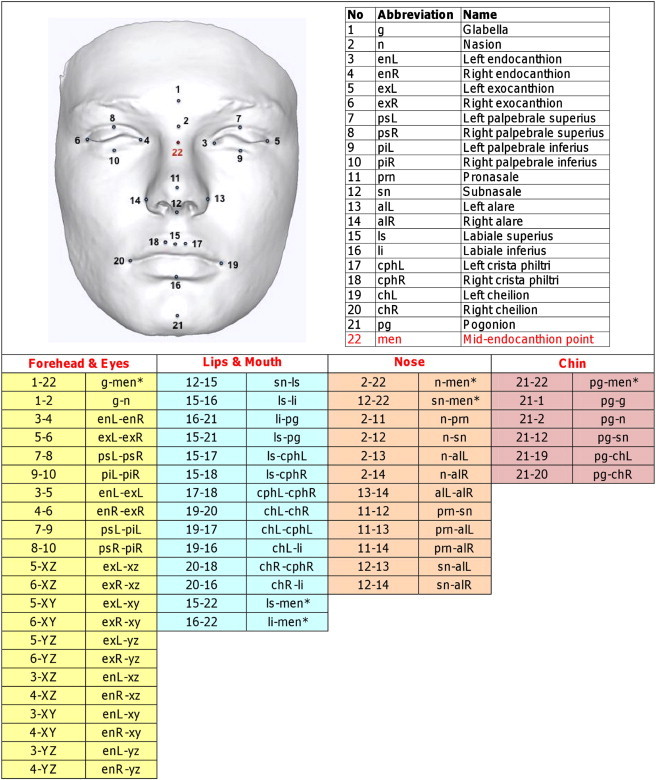
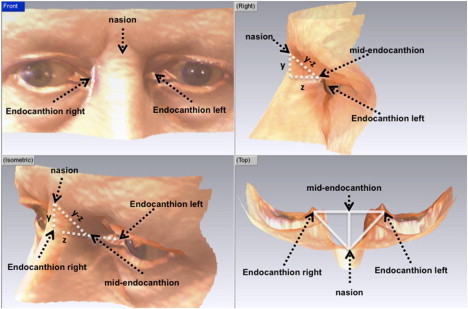
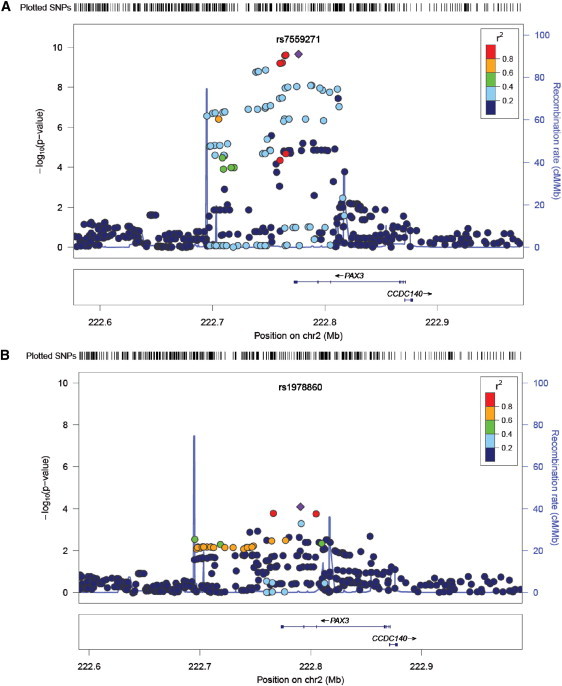
Craniofacial morphology is highly heritable, but little is known about which genetic variants influence normal facial variation in the general population. We aimed to identify genetic variants associated with normal facial variation in a population-based cohort of 15-year-olds from the Avon Longitudinal Study of Parents and Children. 3D high-resolution images were obtained with two laser scanners, these were merged and aligned, and 22 landmarks were identified and their x, y, and z coordinates used to generate 54 3D distances reflecting facial features. 14 principal components (PCs) were also generated from the landmark locations. We carried out genome-wide association analyses of these distances and PCs in 2,185 adolescents and attempted to replicate any significant associations in a further 1,622 participants. In the discovery analysis no associations were observed with the PCs, but we identified four associations with the distances, and one of these, the association between rs7559271 in PAX3 and the nasion to midendocanthion distance (n-men), was replicated (p = 4 × 10(-7)). In a combined analysis, each G allele of rs7559271 was associated with an increase in n-men distance of 0.39 mm (p = 4 × 10(-16)), explaining 1.3% of the variance. Independent associations were observed in both the z (nasion prominence) and y (nasion height) dimensions (p = 9 × 10(-9) and p = 9 × 10(-10), respectively), suggesting that the locus primarily influences growth in the yz plane. Rare variants in PAX3 are known to cause Waardenburg syndrome, which involves deafness, pigmentary abnormalities, and facial characteristics including a broad nasal bridge. Our findings show that common variants within this gene also influence normal craniofacial development.
Copyright © 2012 The American Society of Human Genetics. Published by Elsevier Inc. All rights reserved.
Figures
References
-
- Kohn L.A.P. The role of genetics in craniofacial morphology and growth. Annu. Rev. Anthropol. 1991;20:261–278.
-
- Hunter W.S., Balbach D.R., Lamphiear D.E. The heritability of attained growth in the human face. Am. J. Orthod. 1970;58:128–134. - PubMed
-
- Nakata N., Yu P.I., Davis B., Nance W.E. The use of genetic data in the prediction of craniofacial dimensions. Am. J. Orthod. 1973;63:471–480. - PubMed
-
- Johannsdottir B., Thorarinsson F., Thordarson A., Magnusson T.E. Heritability of craniofacial characteristics between parents and offspring estimated from lateral cephalograms. Am. J. Orthod. Dentofacial Orthop. 2005;127:200–207. quiz 260–261. - PubMed
-
- Benson P.E., Richmond S. A critical appraisal of measurement of the soft tissue outline using photographs and video. Eur. J. Orthod. 1997;19:397–409. - PubMed
Publication types
MeSH terms
Substances
Grants and funding
LinkOut - more resources
Full Text Sources
