. 2012 May 15;261(1):1-9.
doi: 10.1016/j.taap.2012.02.002. Epub 2012 Feb 11.

Endogenous bile acid disposition in rat and human sandwich-cultured hepatocytes

Affiliations

Endogenous bile acid disposition in rat and human sandwich-cultured hepatocytes

Tracy L Marion et al. Toxicol Appl Pharmacol. .

Abstract

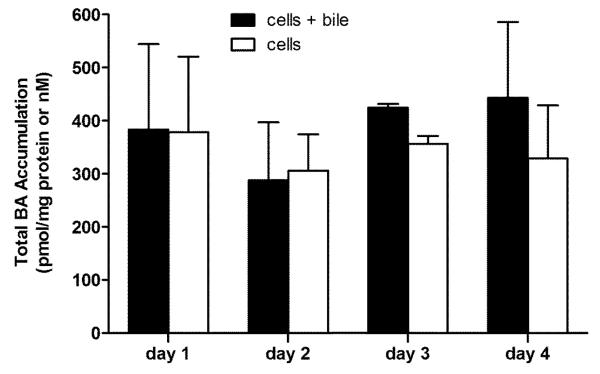
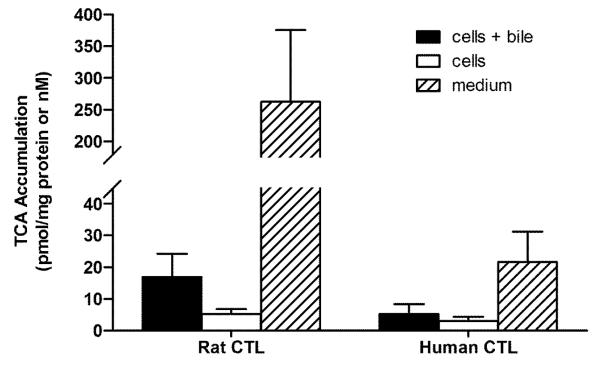
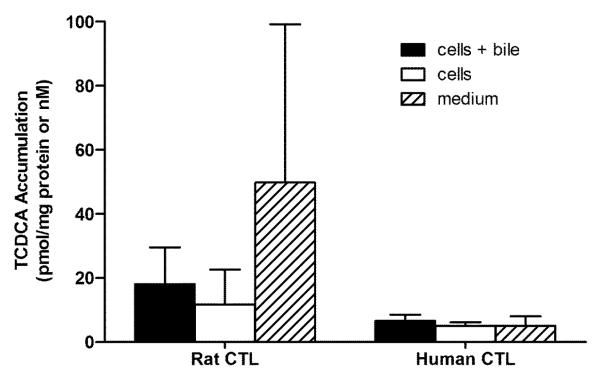
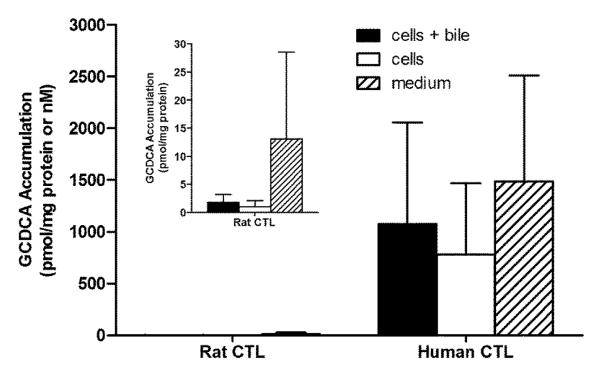
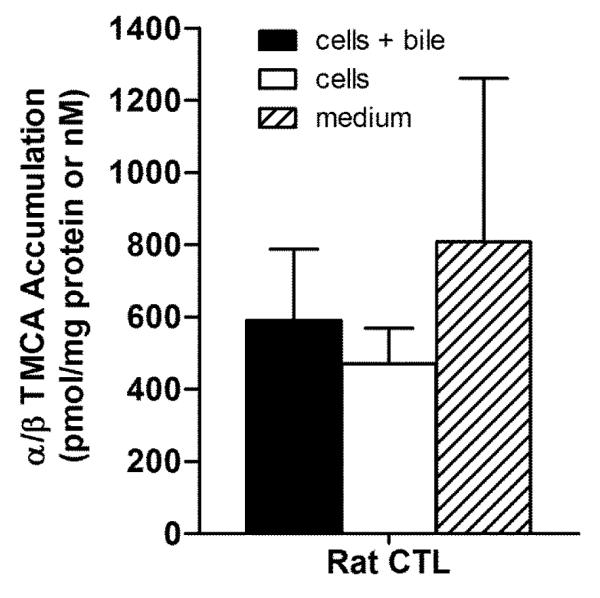
Sandwich-cultured hepatocytes (SCH) are used commonly to investigate hepatic transport protein-mediated uptake and biliary excretion of substrates. However, little is known about the disposition of endogenous bile acids (BAs) in SCH. In this study, four endogenous conjugated BAs common to rats and humans [taurocholic acid (TCA), glycocholic acid (GCA), taurochenodeoxycholic acid (TCDCA), and glycochenodeoxycholic acid (GCDCA)], as well as two BA species specific to rodents (α- and β-tauromuricholic acid; α/β TMCA), were profiled in primary rat and human SCH. Using B-CLEAR® technology, BAs were measured in cells+bile canaliculi, cells, and medium of SCH by LC-MS/MS. Results indicated that, just as in vivo, taurine-conjugated BA species were predominant in rat SCH, while glycine-conjugated BAs were predominant in human SCH. Total intracellular BAs remained relatively constant over days in culture in rat SCH. Total BAs in control (CTL) cells+bile, cells, and medium were approximately 3.4, 2.9, and 8.3-fold greater in human than in rat. The estimated intracellular concentrations of the measured total BAs were 64.3±5.9 μM in CTL rat and 183±56 μM in CTL human SCH, while medium concentrations of the total BAs measured were 1.16±0.21 μM in CTL rat SCH and 9.61±6.36 μM in CTL human SCH. Treatment of cells for 24h with 10 μM troglitazone (TRO), an inhibitor of the bile salt export pump (BSEP) and the Na⁺-taurocholate cotransporting polypeptide (NTCP), had no significant effect on endogenous BAs measured at the end of the 24-h culture period, potentially due to compensatory mechanisms that maintain BA homeostasis. These data demonstrate that BAs in SCH are similar to in vivo, and that SCH may be a useful in vitro model to study alterations in BA disposition if species differences are taken into account.


Figures

Figure 1A
Figure 1A
Accumulation (pmol/mg protein) of total BAs (TCA, GCA, TCGCA, GCDCA, α/β TMCA) in cells+bile (solid bars) and cells (open bars) in rat SCH over days 1 through 4 of culture. Values represent mean ± range of duplicate determinations in n=2 experiments.
Figure 1B
Figure 1B
Protein expression of Cyp7a1 in CTL rat SCH cell lysates over days 1 through 4 of culture; β-actin served as the loading control. Same-day samples represent individual samples collected from duplicate wells.
Figure 2
Figure 2
Accumulation in pmol/mg protein (cells+bile and cells) and nM (medium) of TCA in cells+bile (solid bars), cells (open bars), and medium (hatched bars) in rat and human SCH following 24 h treatment with vehicle (0.1% DMSO). In CTL rat SCH, values represent the mean ± SD of duplicate or triplicate measurements (cells+bile and cells) in n=4 experiments, and mean ± SD of 3-6 measurements (medium) in n=3 experiments. In human SCH, values represent mean ± SD of single or duplicate measurements (cells+bile and cells) and mean ± SD of 2-6 measurements (medium) in n=4 experiments.
Figure 3
Figure 3
Accumulation in pmol/mg protein (cells+bile and cells) and nM (medium) of GCA in cells+bile (solid bars), cells (open bars), and medium (hatched bars) in rat and human SCH following 24 h treatment with vehicle (0.1% DMSO). In CTL rat SCH, values represent the mean ± SD of duplicate or triplicate measurements (cells+bile and cells) in n=4 experiments, and mean ± SD of 3-6 measurements (medium) in n=3 experiments. In human SCH, values represent mean ± SD of single or duplicate measurements (cells+bile and cells) and mean ± SD of 2-6 measurements (medium) in n=4 experiments. Inset shows accumulation of GCA in cells+bile, cells, and medium in rat SCH with the y-axis scaled for easier visualization.
Figure 4
Figure 4
Accumulation in pmol/mg protein (cells+bile and cells) and nM (medium) of TCDCA in cells+bile (solid bars), cells (open bars), and medium (hatched bars) in rat and human SCH following 24 h treatment with vehicle (0.1% DMSO). In CTL rat SCH, values represent the mean ± SD of duplicate or triplicate measurements (cells+bile and cells) in n=4 experiments, and mean ± SD of 3-6 measurements (medium) in n=3 experiments. In human SCH, values represent mean ± SD of single or duplicate measurements (cells+bile and cells) and mean ± SD of 2-6 measurements (medium) in n=4 experiments.
Figure 5
Figure 5
Accumulation in pmol/mg protein (cells+bile and cells) and nM (medium) of GCDCA in cells+bile (solid bars), cells (open bars), and medium (hatched bars) in rat and human SCH following 24 h treatment with vehicle (0.1% DMSO). In CTL rat SCH, values represent the mean ± SD of duplicate or triplicate measurements (cells+bile and cells) in n=4 experiments, and mean ± SD of 3-6 measurements (medium) in n=3 experiments. In human SCH, values represent mean ± SD of single or duplicate measurements (cells+bile and cells) and mean ± SD of 2-6 measurements (medium) in n=4 experiments. Inset shows accumulation of GCDCA in cells+bile, cells, and medium in rat SCH with the y-axis scaled for easier visualization.
Figure 6
Figure 6
Accumulation in pmol/mg protein (cells+bile and cells) and nM (medium) of α/β TMCA measured in cells+bile (solid bar), cells (open bar), and medium (hatched bar) in rat SCH following 24 h treatment with vehicle (0.1% DMSO). Values represent the mean ± SD of duplicate or triplicate measurements (cells+bile and cells) in n=4 experiments, and mean ± SD of 3 or 6 measurements (medium) in n=3 experiments.
Figure 7
Figure 7
Accumulation in pmol/mg protein (cells+bile and cells) and nM (medium) of total BAs measured in cells+bile (solid bars), cells (open bars), and medium (hatched bars) in rat and human SCH following 24 h treatment with vehicle (0.1% DMSO). Inset shows accumulation of BAs in cells+bile, cells, and medium in rat SCH with the y-axis scaled for easier visualization.

Similar articles

Cited by

References

    1. Ahlberg J, Angelin B, Bjorkhem I, Einarsson K. Individual bile acids in portal venous and systemic blood serum of fasting man. Gastroenterology. 1977;73:1377–82. - PubMed
    1. Alvaro D, Cantafora A, Attili AF, Ginanni Corradini S, De Luca C, Minervini G, Di Biase A, Angelico M. Relationships between bile salts hydrophilicity and phospholipid composition in bile of various animal species. Comp Biochem Physiol B. 1986;83:551–4. - PubMed
    1. Ansede JH, Smith WR, Perry CH, St Claire RL, 3rd, Brouwer KR. An in vitro assay to assess transporter-based cholestatic hepatotoxicity using sandwich-cultured rat hepatocytes. Drug Metab Dispos. 2010;38:276–80. - PubMed
    1. Assem M, Schuetz EG, Leggas M, Sun D, Yasuda K, Reid G, Zelcer N, Adachi M, Strom S, Evans RM, Moore DD, Borst P, Schuetz JD. Interactions between hepatic Mrp4 and Sult2a as revealed by the constitutive androstane receptor and Mrp4 knockout mice. J Biol Chem. 2004;279:22250–7. - PubMed
    1. Blitzer BL, Boyer JL. Cellular mechanisms of bile formation. Gastroenterology. 1982;82:346–57. - PubMed

Publication types

MeSH terms