. 2012 May 10;159(3):384-92.
doi: 10.1016/j.jconrel.2012.01.045. Epub 2012 Feb 8.

Systemic delivery of siRNA nanoparticles targeting RRM2 suppresses head and neck tumor growth

Affiliations

Systemic delivery of siRNA nanoparticles targeting RRM2 suppresses head and neck tumor growth

Mohammad Aminur Rahman et al. J Control Release. .

Abstract

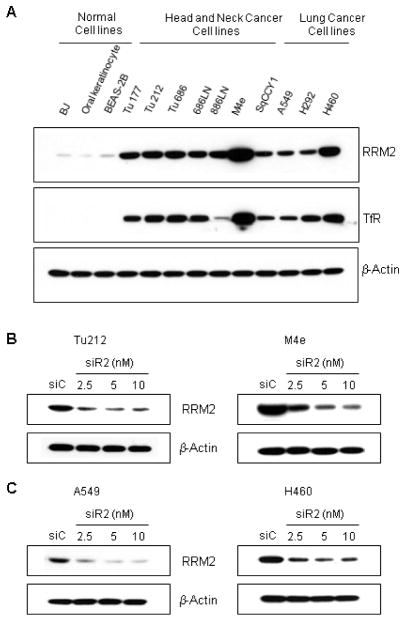
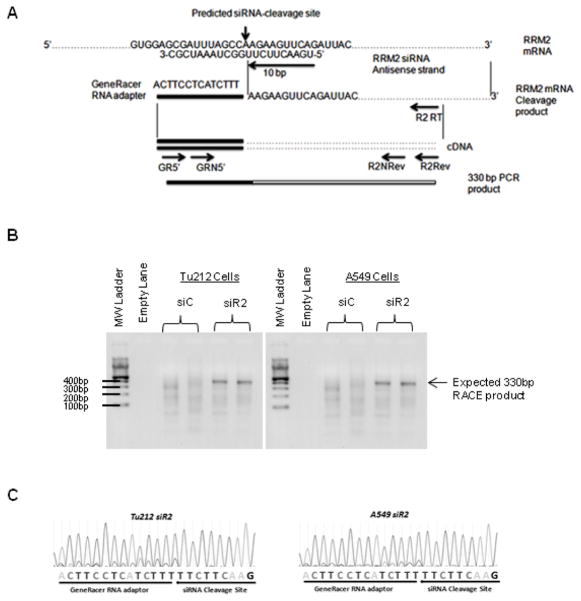
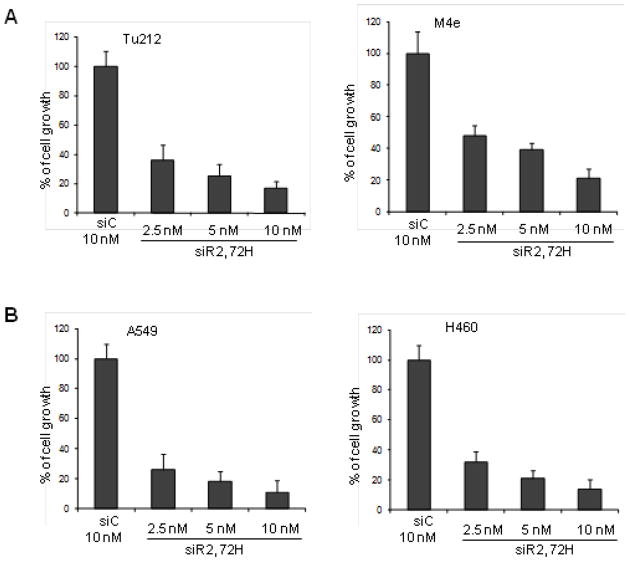
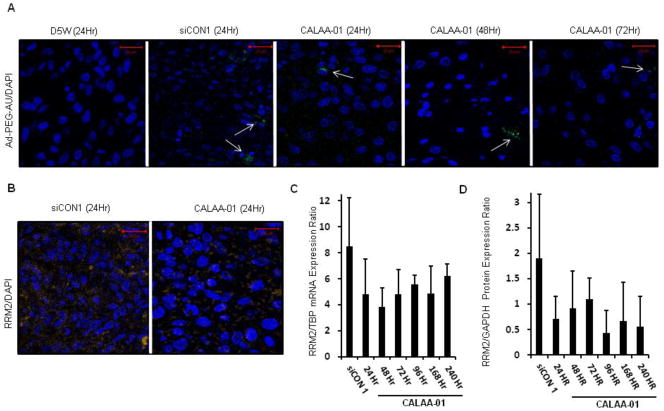
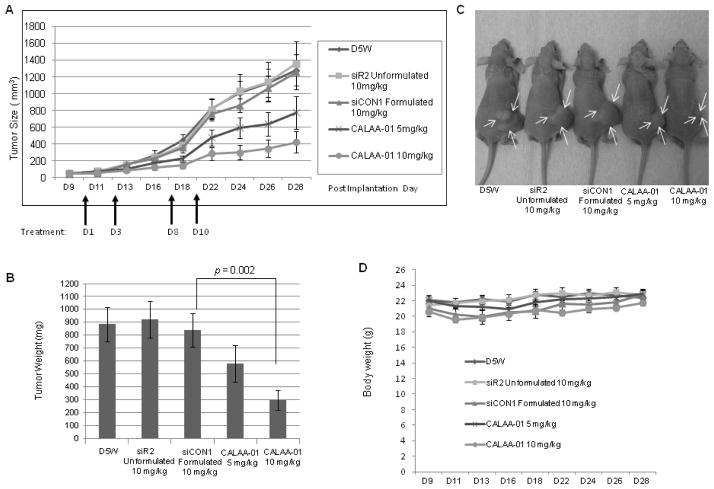
Systemic delivery of siRNA to solid tumors remains challenging. In this study, we investigated the systemic delivery of a siRNA nanoparticle targeting ribonucleotide reductase subunit M2 (RRM2), and evaluated its intratumoral kinetics, efficacy and mechanism of action. Knockdown of RRM2 by an RNAi mechanism strongly inhibited cell growth in head and neck squamous cell carcinoma (HNSCC) and non-small cell lung cancer (NSCLC) cell lines. In a mouse xenograft model of HNSCC, a single intravenous injection led to the accumulation of intact nanoparticles in the tumor that disassembled over a period of at least 3days, leading to target gene knockdown lasting at least 10days. A four-dose schedule of siRNA nanoparticle delivering RRM2 siRNA targeted to HNSCC tumors significantly reduced tumor progression by suppressing cell proliferation and inducing apoptosis. These results show promise for the use of RRM2 siRNA-based therapy for HNSCC and possibly NSCLC.


Conflict of interest statement

Dr. Davis has founders stock in Calando Pharmaceuticals and there is no financial conflict of interest to other authors.

Figures

Fig. 1
Fig. 1
RRM2 and TfR proteins are expressed in HNSCC and NSCLC cells and siR2 efficiently suppresses RRM2 protein. (A) RRM2 and TfR expression in normal, HNSCC and NSCLC cell lines. Normal cell line, BJ (human fibroblast), primary culture of BEAS-2B (bronchial epithelial), normal oral keratinocytes, HNSCC (Tu177, Tu212, Tu686, 686LN, 886LN, M4e, SqCCY1) and lung cancer (A549, H292, H460) cell lines were cultured for 24 hours before cell lysis. Cell lysates were examined for expression of RRM2 (upper panel) and TfR (middle panel) by Western blotting. β-actin protein (lower panel) was immunoblotted to confirm equal loading amounts. One blot is pictured from three independent experiments. (B) HNSCC cell lines, Tu212 (left panel) and M4e (right panel), (C) NSCLC cell lines, A549 (left panel) and H460 (right panel), were transfected with 2.5, 5 and 10nM of RRM2-specific (siR2) or 10nM of control (siC) siRNA for 72h. Western blotting was performed for determination of RRM2 and β-actin expression.
Fig. 2
Fig. 2
siR2 silences RRM2 via an RNAi mechanism in HNSCC and NSCLC cell lines. (A) Schematic diagram showing the predicted cleavage site of RRM2 siRNA and primers used for PCR amplification of the cleavage fragment. GR5′: GeneRacer 5′ primer, GRN5′: GeneRacer 5′ nested primer, R2RT: RRM2 gene-specific RT primer, R2Rev: RRM2 gene-specific reverse primer, R2Nrev: RRM2 gene-specific nested primer. (B) 5′-RLM-RACE product detection of siRNA-induced RRM2 mRNA cleavage fragment in Tu212 (left panel) and A549 (right panel) cells. (C) Sequencing chromatographs obtained from positive RACE bands.
Fig. 3
Fig. 3
Depletion of RRM2 by siRNA inhibits cellular growth. (A) HNSCC cell lines, Tu212 (left panel) and M4e (right panel), were transfected with 2.5, 5 and 10nM of siR2 or 10nM of siC. After 72h, cell growth was measured by SRB assay (error bars are mean +SD from 3 independent experiments). (B) Cell growth assay in NSCLC cell lines, A549 (left panel) and H460 (right panel).
Fig. 4
Fig. 4
Time course of nanoparticle intratumoral residency and RRM2 expression levels in Tu212 tumors of mice treated with single intravenous dose of 5% dextrose (D5W), control siRNA-containing CDP/nanoparticle (siCON1 10mg/kg) or siR2-containing CDP/nanoparticles (CALAA-01 10mg/kg). (A) Detection of CDP/siRNA nanoparticles with Au-PEG-AD stain (green) in tumors at 24, 48, and 72 hours after treatment (white arrows point to clusters of CDP/nanoparticles; nuclei stained with DAPI in blue). (B) Immunohistochemical analysis of RRM2 protein expression (orange) 24 hours after treatment with siCON1- or CALAA-01 nanoparticles counterstained with DAPI (blue). (C) Real time qRT-PCR analysis of tumor RRM2 mRNA expression over time (siCON1 24 hr, CALAA-01 24, 48, 72, 96, 168, 240 hr) (error bars are mean +SD, n=3). (D) Western blot analysis of tumor RRM2 protein expression over time (error bars are mean +SD from 3 independent blots).
Fig. 5
Fig. 5
Systemically delivered CALAA-01 in a four-dose schedule (days 1, 3, 8 and 10) efficiently reduced tumor growth in a Tu212 xenograft model. (A) Tumor growth (tumor volume = 0.5×l×w2) progression in five groups: D5W, naked siR2 (10 mg/kg), siCON1 (formulated 10 mg/kg) and siR2-containing nanoparticle (CALAA-01 5 mg/kg and 10 mg/kg). First dose started on Day 10 after implantation and tumor growth was monitored until Day 28 (endpoint of tumor volume 1500 mm3) (error bars are mean ±SE, n=8). Statistical analysis (all days) between groups was as follows: D5W vs CALAA-01 10 mg/kg: P=0.0002; siR2 Unformulated vs CALAA-01 10 mg/kg: P=0.0007; siCON1 vs CALAA-01 10 mg/kg: P=0.0004; D5W vs CALAA-01 5 mg/kg: P=0.03; siR2 Unformulated vs CALAA-01 5 mg/kg: P=0.04; siCON1 vs CALAA-01 5 mg/kg: P=0.09. (B) Mice were sacrificed, tumors were collected from each treatment group on Day 28 and tumors were weighed (error bars are mean ±SD, n=8). Statistical analysis between groups was as follows: D5W vs CALAA-01 10 mg/kg: P=0.0019; siR2 Unformulated vs CALAA-01 10 mg/kg: P=0.0016; siCON1 vs CALAA-01 10 mg/kg: P=0.0024. (C) Representative mouse from each group of D5W, naked siR2, siCON1, CALAA-01 5 mg/kg and 10 mg/kg. Arrows indicated tumor area. (D) Body weights throughout study in each treated group (error bars are mean ± SD, n=8).
Fig. 6
Fig. 6
RRM2 expression and cell proliferation were reduced followed by induction of apoptosis upon four doses of CALAA-01 in the Tu212 xenograft model. We used xenograft tumor and tumor tissue sections which were collected on Day 28 of the study, meaning 10 days after the last injection and during the time of sacrifice. The dosing schedule is illustrated in Figure 5A. (A) Relative RR activity in tumor tissues of each mouse from each group was plotted graphically (error bars are mean ±SD, n=8, siCON1 vs CALAA-01 10 mg/kg: P=0.03 and siR2 unformulated vs CALAA-01 10 mg/kg: P=0.01). (B) RRM2 and Ki67 expression detected in xenograft tissue by IHC analysis. Representative images shown from siCON1 and CALAA-01 10 mg/kg groups (brown stain for RRM2, and Ki67 and nuclei were counterstained by hematoxylin, blue; magnification X200). (C) Apoptosis was detected by xenograft tumor tissue staining with TUNEL (green) and nuclei (blue), Magnification X200.

References

    1. Fire A, Xu S, Montgomery MK, Kostas SA, Driver SE, Mello CC. Potent and specific genetic interference by double-stranded RNA in Caenorhabditis elegans. Nature. 1998;391:806–811. - PubMed
    1. Bumcrot D, Manoharan M, Koteliansky V, Sah DW. RNAi therapeutics: a potential new class of pharmaceutical drugs. Nat Chem Biol. 2006;2:711–719. - PMC - PubMed
    1. Castanotto D, Rossi JJ. The promises and pitfalls of RNA-interference-based therapeutics. Nature. 2009;457:426–433. - PMC - PubMed
    1. Takeshita F, Ochiya T. Therapeutic potential of RNA interference against cancer. Cancer Sci. 2006;97:689–696. - PMC - PubMed
    1. Davis ME, Chen ZG, Shin DM. Nanoparticle therapeutics: an emerging treatment modality for cancer. Nat Rev Drug Discov. 2008;7:771–782. - PubMed

Publication types

MeSH terms

Substances