. 2012 Mar 20;22(6):545-52.
doi: 10.1016/j.cub.2012.02.005. Epub 2012 Feb 16.

Spatial parkin translocation and degradation of damaged mitochondria via mitophagy in live cortical neurons

Affiliations

Spatial parkin translocation and degradation of damaged mitochondria via mitophagy in live cortical neurons

Qian Cai et al. Curr Biol. .

Abstract

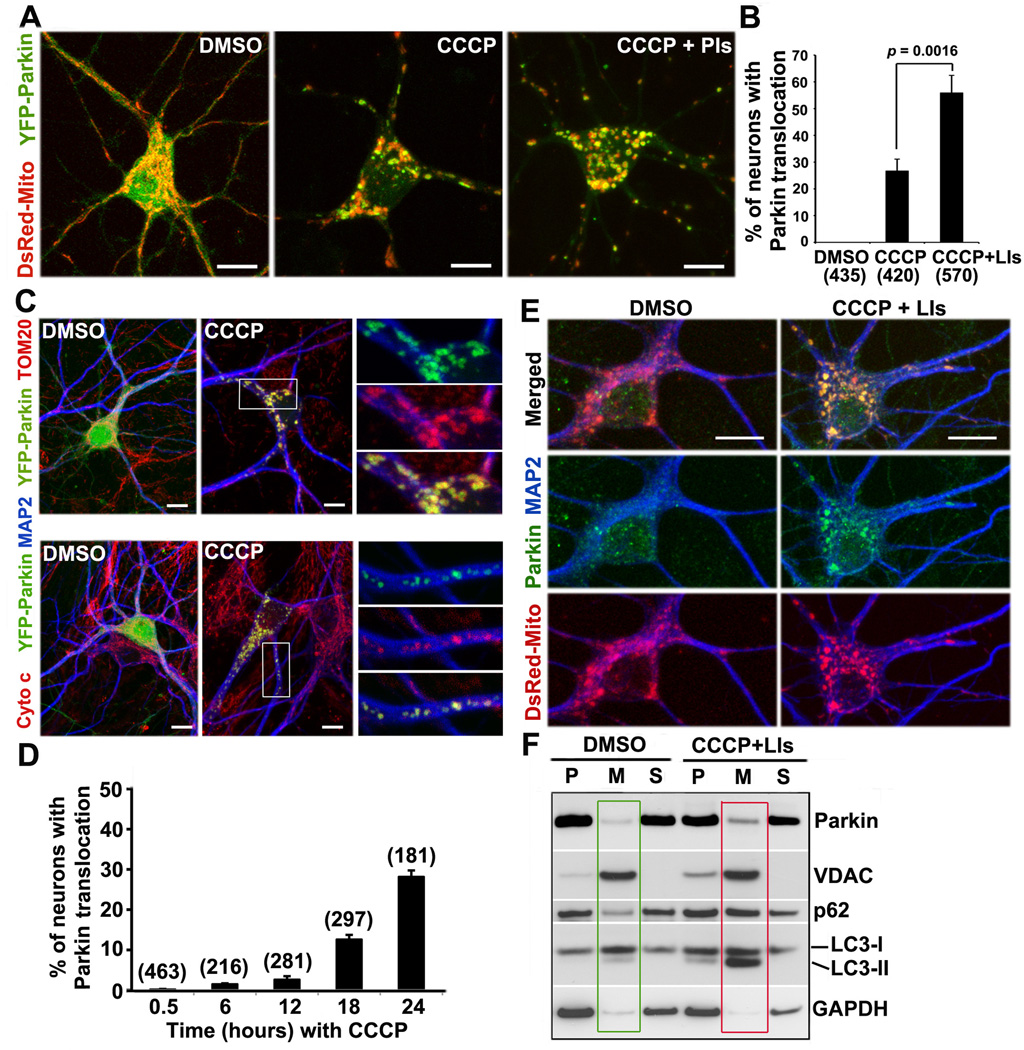
Mitochondria are essential for neuronal survival and function. Proper degradation of aged and damaged mitochondria through mitophagy is a key cellular pathway for mitochondrial quality control. Recent studies have indicated that PINK1/Parkin-mediated pathways ensure mitochondrial integrity and function. Translocation of Parkin to damaged mitochondria induces mitophagy in many nonneuronal cell types. However, evidence showing Parkin translocation in primary neurons is controversial, leaving unanswered questions as to how and where Parkin-mediated mitophagy occurs in neurons. Here, we report the unique process of dissipating mitochondrial Δψ(m)-induced and Parkin-mediated mitophagy in mature cortical neurons. Compared with nonneuronal cells, neuronal mitophagy is a much slower and compartmentally restricted process, coupled with reduced anterograde mitochondrial transport. Parkin-targeted mitochondria are accumulated in the somatodendritic regions where mature lysosomes are predominantly located. Time-lapse imaging shows dynamic formation and elimination of Parkin- and LC3-ring-like structures surrounding depolarized mitochondria through the autophagy-lysosomal pathway in the soma. Knocking down Parkin in neurons impairs the elimination of dysfunctional mitochondria. Thus, our study provides neuronal evidence for dynamic and spatial Parkin-mediated mitophagy, which will help us understand whether altered mitophagy contributes to pathogenesis of several major neurodegenerative diseases characterized by mitochondrial dysfunction and impaired transport.


Figures

Figure 1
Figure 1. CCCP-Induced Recruitment of Parkin to Mitochondria in Cortical Neurons
(A, B) Representative images (A) and quantitative analysis (B) showing CCCP-induced Parkin translocation to mitochondria. Cortical neurons expressing YFP-Parkin and DsRed-Mito at DIV9 were treated for 24 hr with DMSO, 10µM CCCP, or 10µM CCCP + lysosomal inhibitors (LIs). (C) CCCP-induced Parkin translocation to mitochondria labeled by mitochondrial marker TOM20 (upper panels) or cytochrome c (lower panels). Cortical neurons expressing YFP-Parkin were treated with DMSO or 10µM CCCP followed by co-immunostaining with antibodies against MAP2 and TOM20 or cytochrome c. The right three panels show enlarged views of the boxed area. (D) Time course of Parkin translocation following depolarization. Neurons at DIV8-10 were imaged at sequential time points during CCCP treatment. (E) Endogenous Parkin translocation to mitochondria. Cortical neurons expressing DsRed-Mito at DIV10 were treated with DMSO or CCCP/LIs for 24 hr, followed by immunostaining with a monoclonal Parkin antibody (Abcam). Note that CCCP/LIs treatment induces the recruitment of endogenous Parkin to mitochondria. (F) Increased endogenous Parkin associates with mitochondria following CCCP/LIs treatment (red box) relative to that with DMSO control (green box). Cortical neurons at DIV13 were incubated with DMSO or 10µM CCCP/LIs for 24 hr and then subjected to fractionation into post-nuclear supernatant (P), mitochondria-enriched membrane pellet (M), and cytosol supernatant (S). 10µg of protein was sequentially immunoblotted with antibodies against Parkin (monoclonal, Santa Crutz) and various markers including VDAC (mitochondria), GAPDH (cytosol), p62/SQSTM1 and LC3 (autophagy). Scale bars: 10µm. Data was quantified from the number of neurons indicated in parentheses from 3–4 independent experiments. Error bars: SEM. Student’s t test.
Figure 2
Figure 2. Selective Parkin Recruitment to Depolarized Mitochondria
(A–C) Representative images (A, B) and quantitative analysis (C) showing translocation of YFP-Parkin to depolarized mitochondria. Cortical neurons expressing YFP-Parkin and CFP-Mito at DIV9 were treated with DMSO or 10µM CCCP for 24 hr followed by loading with mitochondrial Δψm-dependent dye TMRE for 30 min prior to imaging. Arrows indicate depolarized mitochondria labeled by CFP-Mito but unlabeled by TMRE. Arrowheads represent polarized mitochondria marked by both CFP-Mito and TMRE, which are un-labeled by Parkin. TMRE mean intensity was normalized to DMSO control neurons. Note that neurons recovered from CCCP-treatment maintain normal TMRE mean intensity (p<0.60) while neurons displaying Parkin translocation have reduced TMRE mean intensity in the soma (p<0.001) relative to that of control neurons. (D) Time-lapse imaging of live cortical neurons showing slow and dynamic recruitment of YFP-Parkin to mitochondria in the soma. Neurons were treated for 24 hr with 10µM CCCP, followed by 52 min time-lapse imaging. Graphs to the right are line scans of relative DsRed-mito and YFP-Parkin fluorescence intensities in the images at respective time points (left panels). (E) siRNA-mediated Parkin knock down in neurons. Cortical neurons were transfected with Parkin-siRNA or control siRNA at DIV0 and protein was harvested at DIV4. 10µg of total protein was sequentially immunoblotted with antibodies against Parkin and various markers including HSP60 and Tom20 (mitochondria), p115 (Golgi), GAPDH (cytosol). (F, G) Representative images (F) and quantitative analysis (G) showing accumulation of depolarized mitochondria by knocking down Parkin in cortical neurons, leading to more mitochondria with reduced or no TMRE staining following CCCP treatment. Arrows point to mitochondria with high TMRE intensity (con-shRNA) or low TMRE intensity (Parkin-shRNA). CFP-Mito*: color converted from cyan to green for better contrast. Quantitative data was expressed as normalized TMRE mean intensity in the soma (upper graph) or % of neurons with recovered TMRE intensity following CCCP treatment (lower graph). Data was collected from the number of neurons indicated in parentheses from 3 independent experiments. Scale bars in A and F: 10µm; in B and D: 5µm. Error bars: SEM. Student’s t test.
Figure 3
Figure 3. Altered Mitochondrial Transport During Slow Parkin translocation
(A) Representative images showing CCCP-induced Parkin translocation to mitochondria accumulated in the somatodendritic regions. Cortical neurons at DIV9 were treated for 24 hr with 10µM CCCP/LIs. Panels (A–a) show enlarged views of the boxed somatodendritic area. Arrows indicate Parkin ring-like structures surrounding fragmented mitochondria while an arrowhead marks mitochondria unlabeled by Parkin. Panels (A–b) are enlarged views of a dendritic process showing no Parkin-labeled mitochondria at distal regions. (B–D) Representative kymographs (B) and quantitative analysis (C, D) showing that Parkin translocation is accompanied by altered mobility, velocity, and flux of axonal mitochondria. Cortical neurons at DIV9 were treated with DMSO or 10µM CCCP for 24 hr, followed by 15-min time-lapse recordings. Vertical lines represent stationary organelles; oblique lines or curves to the right represent anterograde transport; and lines to the left indicate retrograde movement. Relative mitochondrial mobility was quantified from the number of neurons (C) or the number of mitochondria and axons (D) indicated in parentheses. Note that neurons recovered from CCCP display normal or slightly altered transport while neurons with Parkin translocation show significant changes in mitochondrial mobility. (E) Immobilizing mitochondria by expressing syntaphilin (SNPH) results in Parkin recruitment to distal mitochondria. Cortical neurons co-expressing SNPH (upper panel) or without SNPH over-expression (lower panel) were treated with CCCP/LIs for 24 hr at DIV9. Arrows point to Parkin-targeted distal mitochondria and arrowheads indicate Parkin-negative distal mitochondria in a control neuron. Error bars: SEM. Student’s t test. Scale bars: 10µm.
Figure 4
Figure 4. Parkin-Targeted Mitochondria Are Degraded through the Autophagy-Lysosomal Pathway in the Somatodendritic Regions
(A) Representative images showing CCCP-induced LC3 recruitment to depolarized mitochondria. Cortical neurons expressing GFP-LC3 and DsRed-Mito at DIV9 were treated with DMSO, 10µM CCCP, or 10µM CCCP/LIs for 24 hr. Arrows indicate co-localization of mitochondria with GFP-LC3. (B) CCCP-induced co-localization of mitochondria and lysosomes (indicated by arrows). Neurons expressing GFP-LAMP1 and DsRed-Mito at DIV9 were treated with DMSO or 10µM CCCP/LIs for 24 hr. (C) Time-lapse imaging showing dynamic emergence and disappearance of Parkin and LC3-labeled autophagic vacuoles in the somatodendritic regions. Neurons expressing GFP-LC3 and mCherry-Parkin were treated for 24 hr with 10µM CCCP, followed by time-lapse imaging. While co-localized ring-like structures of mCherry-Parkin and GFP-LC3 (white arrows) gradually disappeared, some new puncta (red arrows) emerged during the 25-min recording time. (D) Time-lapse imaging showing disappearance of a Parkin-associated mitochondrion (#1) in the soma following treatment with 10µM CCCP. Lower panel shows normalized DsRed-Mito fluorescence intensity of the mitochondrion #1 (Parkin-positive) and #2 (Parkin-negative). Fluorescence intensity for Mito #1 gradually disappears during a 38-min recording period. DsRed-mito fluorescence intensity of Mito #2 remained consistent throughout the imaging acquisition. Fluorescence intensity of each mitochondrion was normalized to their intensity at t=18 min. Scale bars in A and B: 10µm; in C and D: 5µm.

References

    1. Greene JC, Whitworth AJ, Kuo I, Andrews LA, Feany MB, Pallanck LJ. Mitochondrial pathology and apoptotic muscle degeneration in Drosophila parkin mutants. Proc. Natl. Acad. Sci. USA. 2003;100:4078–4083. - PMC - PubMed
    1. Palacino JJ, Sagi D, Goldberg MS, Krauss S, Motz C, Wacker M, Klose J, Shen J. Mitochondrial dysfunction and oxidative damage in parkin-deficient mice. J. Biol. Chem. 2004;279:18614–18622. - PubMed
    1. Clark IE, Dodson MW, Jiang C, Cao JH, Huh JR, Seol JH, Yoo SJ, Hay BA, Guo M. Drosophila pink1 is required for mitochondrial function and interacts genetically with parkin. Nature. 2006;441:1162–1166. - PubMed
    1. Gautier CA, Kitada T, Shen J. Loss of PINK1 causes mitochondrial functional defects and increased sensitivity to oxidative stress. Proc. Natl. Acad. Sci. USA. 2008;105:11364–11369. - PMC - PubMed
    1. Deng H, Dodson MW, Huang H, Guo M. The Parkinson's disease genes pink1 and parkin promote mitochondrial fission and/or inhibit fusion in Drosophila. Proc. Natl. Acad. Sci. USA. 2008;105:14503–14508. - PMC - PubMed

Publication types

MeSH terms

Substances

LinkOut - more resources