. 2012 Jun;61(2):A3-A11.
doi: 10.1016/j.neuroimage.2012.01.130. Epub 2012 Feb 6.

Functional MRI: A confluence of fortunate circumstances

Functional MRI: A confluence of fortunate circumstances

Peter A Bandettini. Neuroimage. 2012 Jun.

Abstract

Functional MRI has existed for about twenty years and by almost all measures has been incredibly successful. What are the reasons behind this success? In this review, eight extremely fortunate circumstances came together to produce BOLD based fMRI as we know it today. They are as follows: 1. The MRI signal, 2. The MRI relaxation rates, 3. The oxygen-dependent magnetic susceptibility of blood, 4. Neuronal-hemodynamic coupling, 5. The spatial scale of brain activation, 6. The prevalence of scanners able to perform echo planar imaging (EPI), 7. The parallel development of computing power, and 8. The very large group of neuroscientists who, pre-1991, were perfectly poised, willing, and able to exploit the capability of fMRI. These circumstances are discussed in detail. The desired goal of this review is primarily to convey the field of fMRI from the perspective of what was critically important before, during and after its inception and how things might have been if these circumstances would have been different. While there are many instances where circumstances could have been better, it is clear that they worked out extremely well, as the field of fMRI, a major aspect of functional neuroimaging today, is thriving.


Figures

Figure 1
Figure 1
Based on a literature search using Scopus, with search terms “fMRI” or “functional MRI” and limiting the papers to only articles or reviews, this shows a very steady increase in papers published since 2001. An initial jump in the numbers occurred in 1996 to 1997 when echo planar imaging, a tool that is critical to fMRI, became available on clinical scanners.
Figure 2
Figure 2
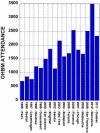
The attendance at the Organization for Human Brain Mapping Meetings since the first meeting in Paris in 1995. The attendance has approximately quadrupled since the first few years.
Figure 3
Figure 3
The spatial scale of the primary BOLD contrast susceptibility contrast sources. The red blood cell, veinuoles and capillaries, and large draining veins all contribute to BOLD contrast. It should be noted that within the large draining veins, as large source of susceptibility contrast is intravascular small compartment (red blood cell) effects.
Figure 4
Figure 4
A depiction of the relative sensitivities of spin-echo (shown as dR2) and gradient-echo (shown as dR2*) sequences to BOLD contrast. This shows several important aspects of BOLD contrast. First, as the compartment size becomes smaller – below 3 microns, the induced effect is lower. At a compartment size about that of a veinuoles, spin-echo effects are maximized. At compartment sizes above 15 microns, gradient-echo sequences remain highly sensitive while spin-echo sequences become less sensitive again. The reason for the differences in the curves is because spin-echo sequences rely on diffusion of spins through gradients to cause irreversible dephasing. Maximum dephasing occurs when the scale of the perturbation in magnetic field approximately matches the diffusion distance.
Figure 5
Figure 5
A flow chart depiction of the cascade of neuronal, physiologic, and physical events that come into play when BOLD contrast is observed. The boxed effects are what I have denoted as extremely fortunate and highly critical for BOLD-based fMRI to exist.
Figure 6
Figure 6
A depiction of how the vasculature is sampled by MRI voxels. Note that the blood volume distribution across voxels is highly inhomogeneous. This inhomogeneity is the primary contributor to the spatial inhomogeneity of magnitude and latency of the signal change as large vessels are most likely to fill a voxel (thus boost the fMRI signal) and show a delayed BOLD fMRI signal change (as they are downstream from the region of activation).
Figure 7
Figure 7
Some of the spatial scales of brain organization. We are fortunate that these spatial scales, from regions such as the motor cortex to finely interleaved tissue such as orientation columns, are all within the imaging capability of MRI and fMRI.

References

    1. Aguirre GK, Detre JA, Zarahn E, Alsop DC. Experimental design and the relative sensitivity of BOLD and perfusion fMRI. NeuroImage. 2002;15:488–500. - PubMed
    1. Ances BM, Leontiev O, Perthen JE, Liang C, Lansing AE, Buxton RB. Regional differences in the coupling of cerebral blood flow and oxygen metabolism changes in response to activation: Implications for BOLD-fMRI. NeuroImage. 2008;39:1510–1521. - PMC - PubMed
    1. Bandettini P. Functional MRI today. International Journal of Psychophysiology. 2007;63:138–145. - PubMed
    1. Bandettini PA. The temporal resolution of Functional MRI. In: Moonen C, Bandettini P, editors. Functional MRI. Springer; Verlag: 1999. pp. 205–220.
    1. Bandettini PA. Sewer pipe, Epoxy, Wire, and finger tapping: the start of fMRI at the medical college of wisconsin. NeuroImage special issue: functional MRI, the science and the stories. 2012 - PMC - PubMed