. 2012 May 21:301:122-40.
doi: 10.1016/j.jtbi.2012.02.002. Epub 2012 Feb 9.

Patient-calibrated agent-based modelling of ductal carcinoma in situ (DCIS): from microscopic measurements to macroscopic predictions of clinical progression

Affiliations

Patient-calibrated agent-based modelling of ductal carcinoma in situ (DCIS): from microscopic measurements to macroscopic predictions of clinical progression

Paul Macklin et al. J Theor Biol. .

Abstract

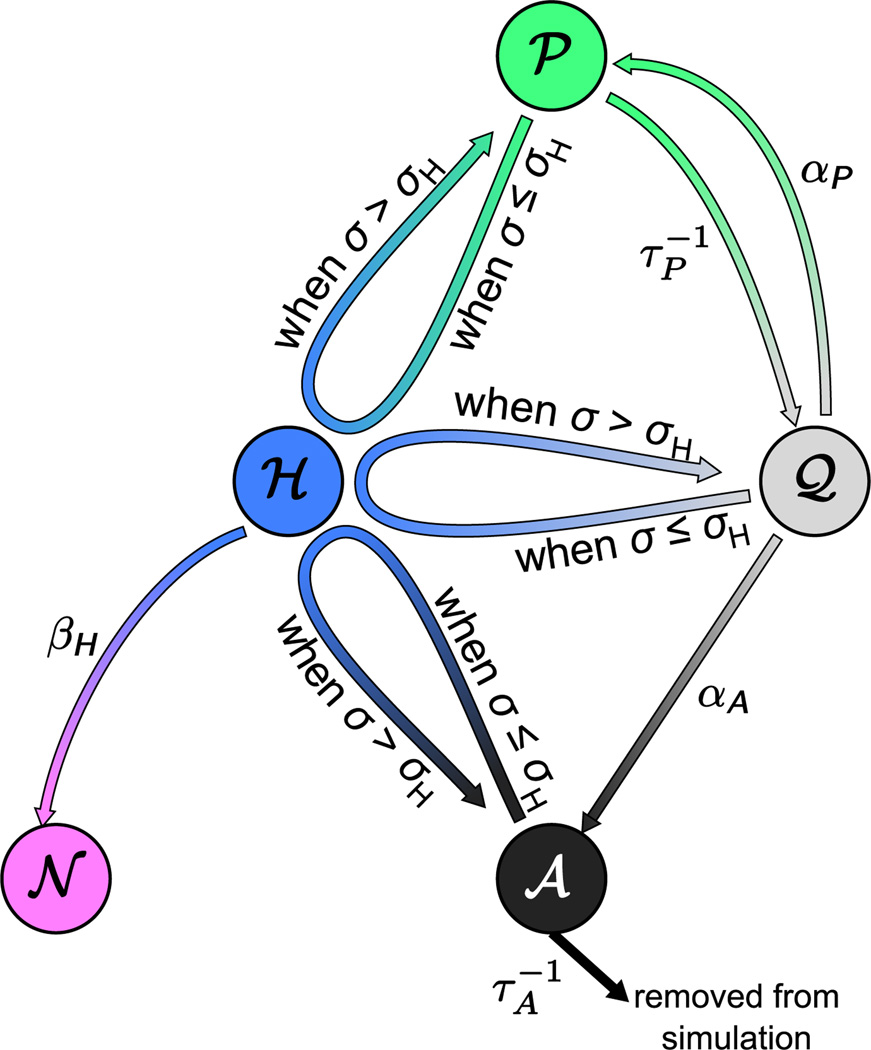
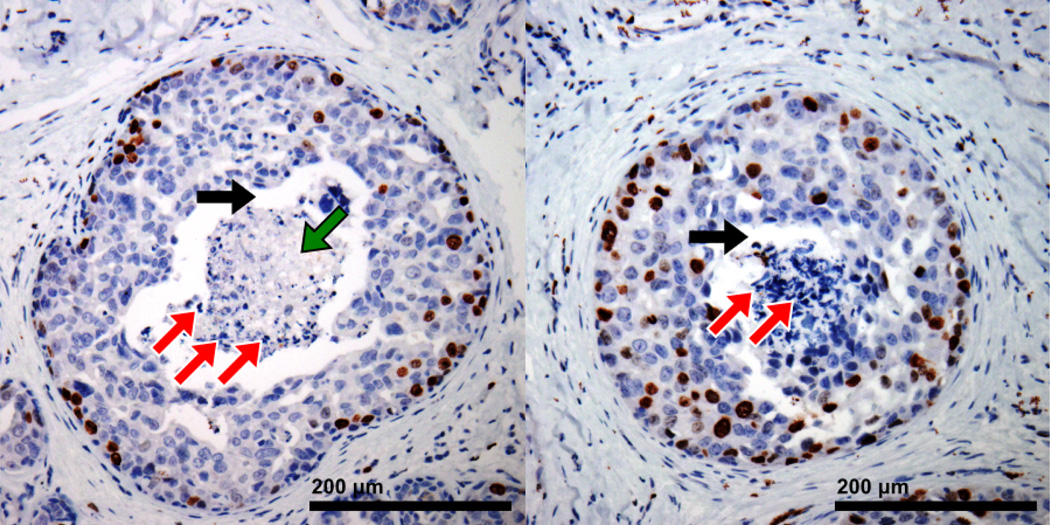
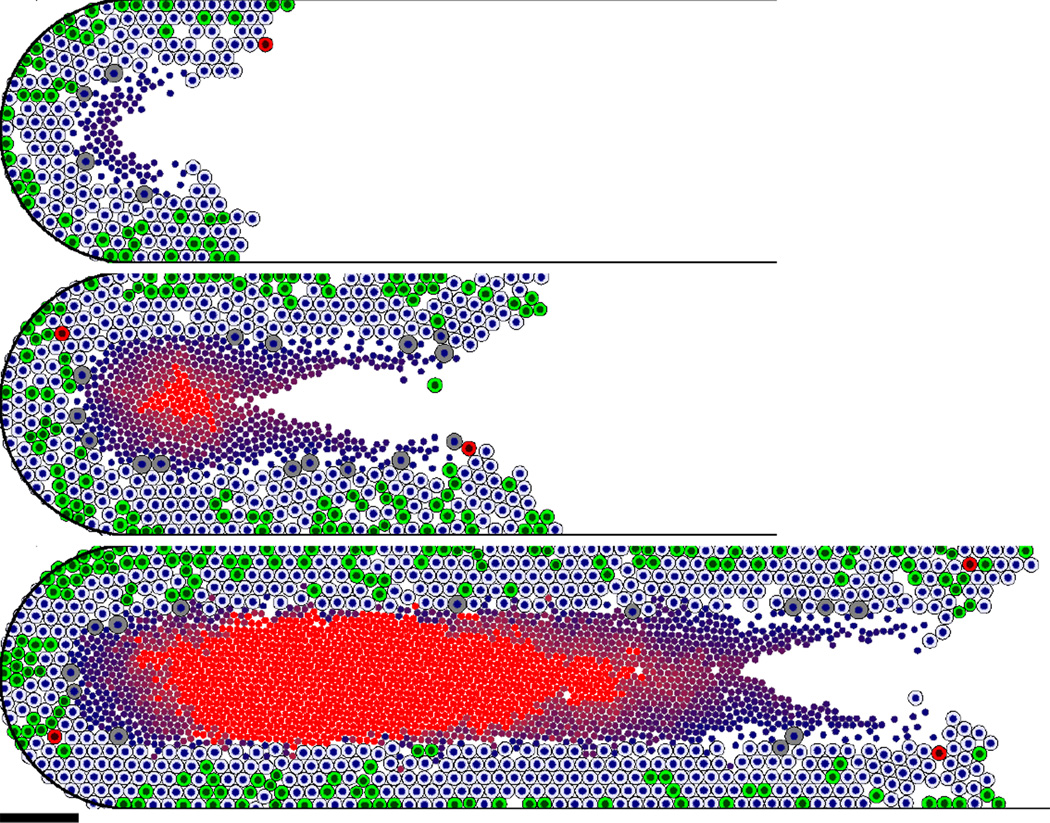
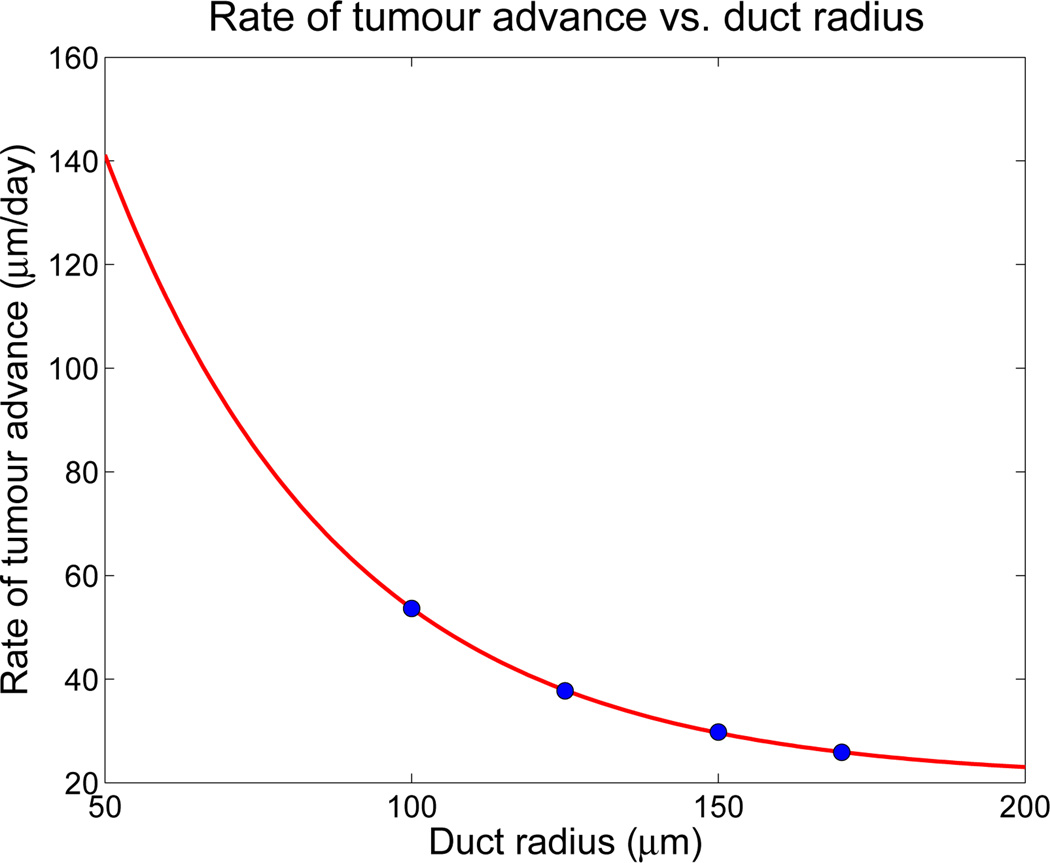
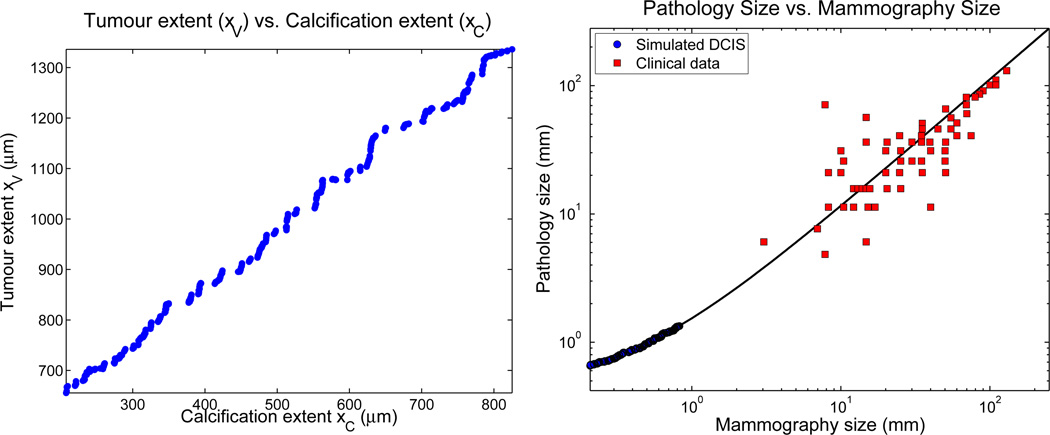
Ductal carcinoma in situ (DCIS)--a significant precursor to invasive breast cancer--is typically diagnosed as microcalcifications in mammograms. However, the effective use of mammograms and other patient data to plan treatment has been restricted by our limited understanding of DCIS growth and calcification. We develop a mechanistic, agent-based cell model and apply it to DCIS. Cell motion is determined by a balance of biomechanical forces. We use potential functions to model interactions with the basement membrane and amongst cells of unequal size and phenotype. Each cell's phenotype is determined by genomic/proteomic- and microenvironment-dependent stochastic processes. Detailed "sub-models" describe cell volume changes during proliferation and necrosis; we are the first to account for cell calcification. We introduce the first patient-specific calibration method to fully constrain the model based upon clinically-accessible histopathology data. After simulating 45 days of solid-type DCIS with comedonecrosis, the model predicts: necrotic cell lysis acts as a biomechanical stress relief and is responsible for the linear DCIS growth observed in mammography; the rate of DCIS advance varies with the duct radius; the tumour grows 7-10mm per year--consistent with mammographic data; and the mammographic and (post-operative) pathologic sizes are linearly correlated--in quantitative agreement with the clinical literature. Patient histopathology matches the predicted DCIS microstructure: an outer proliferative rim surrounds a stratified necrotic core with nuclear debris on its outer edge and calcification in the centre. This work illustrates that computational modelling can provide new insight on the biophysical underpinnings of cancer. It may 1-day be possible to augment a patient's mammography and other imaging with rigorously-calibrated models that help select optimal surgical margins based upon the patient's histopathologic data.


Figures

Fig. 1
Fig. 1. Cell morphology and mechanics
Left: We track the cell volume V and nuclear volume VN (with equivalent spherical radii R and RN, as labelled here); pale grey denotes the cytoplasm (VC), and the darker grey denotes the nucleus (VN). The unknown cell morphology (one possible realisation given as a dashed red curve) has an equivalent spherical morphology (solid blue curve). RA is the maximum adhesive interaction distance. Right: We account for uncertainty in the cell morphology by allowing the equivalent radii to overlap (left two cells), and by allowing adhesive contact beyond their equivalent radii (right two cells).
Fig. 2
Fig. 2. Agent model forces
On Cell 5, find labelled the cell-cell adhesive (Fcca5j) and repulsive (Fccr5j) forces, and the cell-BM adhesive (Fcba5) and repulsive (Fcbr5) forces. We label the net cell locomotive force Floci for Cell 6 (undergoing motility along the BM) and Cell 7 (undergoing motility within the ECM). We show the cell-ECM adhesive force (Fcma7) and fluid drag (Fdrag7) for Cell 7. An earlier version of this figure appeared in advance in Macklin et al. (2009a, 2010b).
Fig. 3
Fig. 3
Potential functions and derivatives for m = n = 1, M = 1, R = 10, RA = 12, RN = 5, cccr = 1, and ccca = 0.5184; s = 7 is the equilibrium spacing between two interacting cells, where −∇ (cccrψ + cccaφ) = 0. cccr and ccca are defined in the following sections. Left: cccrψ + cccaφ. Right: r(cccrψ+cccaφ).
Fig. 4
Fig. 4
Phenotypic transition network in the agent-based model, including quiescent (𝒬), proliferative (𝒫), apoptotic (𝐀), hypoxic (ℋ), and necrotic (𝒩) cells. An earlier version of this figure appeared in advance in Macklin et al. (2010b).
Fig. 5
Fig. 5. 𝒫 sub-model
A cell enters 𝒫 from the quiescent state 𝒬, modelling the G0 to S transition. It then remains in 𝒫 until dividing into two identical daughter cells of half volume. The daughter cells also remain in 𝒫 until completing G1 and “maturing” into full-sized cells; thereafter, they enter the “default” state 𝒬.
Fig. 6
Fig. 6
Ki-67 immunohistochemistry of two DCIS duct cross sections in case 100019. Nuclei of cycling cells (𝒫: S, G2, M, and G1) stain dark red, while nuclei of non-cycling cells (𝒬: G0) counterstain blue. In each duct (sampled from various locations in the tumour to demonstrate typical features), the viable rim is clearly visible, with greatest proliferation along the outer edge. In the duct centres, necrotic cores are filled with partly-degraded nulcear debris (red arrows, pointing up and right), mostly-degraded nuclei (green arrow, pointing down and left), and possibly microcalcifications in the degraded region. Note the physical gap (black horizontal arrows) between the viable rims and the necrotic cores. A colour version of this figure is available in the online edition.
Fig. 7
Fig. 7. Verification of the patient-specific calibration
We compare the simulated (left bars) and patient (right bars) PI (column one), AI (column two), cell density (column three), and viable rim thickness (column four) over the last 15 days of our simulation. Notice that the bars overlap for each datum, and the simulated mean (left triangles) are within the patient variation for each datum. Hence, the calibrated model matches the calibration data within tolerances.
Fig. 8
Fig. 8. Agent-based simulation of DCIS in a 1 mm length of duct
Legend: The black curve denotes the basement membrane. Cell nuclei are the small dark blue circles, quiescent cells (𝒬) are pale blue, proliferating cells (𝒫) are green, apoptosing cells (𝒜) are red, and necrotic cells (𝒩) are grey until they lyse, after which their solid fraction remains as debris (dark circles in centre of duct). The shade of red in the necrotic debris indicates the level of calcification; bright red debris are clinically-detectable microcalcifications (𝒩 with τ > τC). Simulated times (from top to bottom): 0, 7, 14, 21, and 28 days. Bar: 100 µm. A colour version of this figure is available in the online edition.
Fig. 9
Fig. 9. Tumour and microcalcification positions in the duct
The top curve plots the maximum position of viable tumour tissue; the bottom curve plots the maximum calcification position. The lighter line is the least-squares fit of the tumour advance from 11 to 45 days.
Fig. 10
Fig. 10. Additional timepoints for the baseline simulation
From top to bottom, 11, 24, and 45 days. Cells are coloured as in Fig. 8. Bar: 100 µm. A colour version of this figure is available in the online edition.
Fig. 11
Fig. 11. Inverse correlation of the duct radius and rate of tumour advance
For small ducts, little lumen is available for mechanical relaxation, leading to rapid tumour advance. Conversely, growth is slower for larger ducts, with a threshold minimum rate of advance (approximately 20.52 µm/day). The mean proliferative and apoptotic indices were fixed for all simulations.
Fig. 12
Fig. 12. Comparison of mammographic and pathologic DCIS sizes
Left: Our DCIS simulation predicts a linear correlation between the mammographic calcification size (xC) and the actual pathology-measured tumour size (xV). Right: A linear least-squares fit of our simulation data (blue circles) fits clinical data (red squares) from de Roos et al. (2004), further demonstrating our model’s predictivity.
Fig. 13
Fig. 13. Selected DCIS cross-sections at 45 days
a: Close to the leading edge, very little necrotic debris is visible, although the viable rim thickness is comparable to other cross sections. b: Farther from the leading edge, a band of intact necrotic debris surrounds a hollow duct lumen. c: As the distance increases, the lumen is filled with necrotic debris. Nuclei on the outer edge is newer and less degraded; material in the centre is more degraded. d: Farther still, a band of degraded nuclei surrounds a calcified core. e: With increasing distance, the microcalcification occupies a greater portion of the necrotic core. Bar: 100 µm. Cells are coloured as in Fig. 8. A colour version of this figure is available in the online edition.
Fig. 14
Fig. 14
H&E staining of DCIS in several ducts in case 100019. In each labelled duct, a readily visible outer viable rim (with faintly haematoxylin-stained nuclei) is separated from the necrotic core by a physical gap (black horizontal arrows). Duct 1 necrotic core: An outer band of partly degraded nuclei (red arrow, pointing up and right) surrounds a region of partly- or mostly-degraded nuclei (green arrow, pointing down and left). Duct 2 necrotic core: A region of mostly-degraded nuclei (green arrow, pointing down and left) surrounds a microcalcification (white vertical arrow). Duct 3 necrotic core: An outer band of partly degraded nuclei (red arrows, pointing up and right) surrounds a region of partly- or mostly-degraded nuclei (green arrows, pointing down and left), with a central core of microcalcifications (vertical white arrows). This duct is likely the intersection of two or more ducts near a branch point. A colour version of this figure is available in the online edition.

Comment in

References

    1. Abbott RG, Forrest S, Pienta KJ. Simulating the hallmarks of cancer. Artif. Life. 2006;12(4):617–634. - PubMed
    1. American Cancer Society. Atlanta: American Cancer Society, Inc.; 2007. American cancer society breast cancer facts and figures 2007–2008.
    1. Astanin S, Preziosi L. Mathematical modelling of the warburg effect in tumour cords. J. Theor. Biol. 2009;254(4):578–590. - PubMed
    1. Ayre KJ, Hulbert AJ. Dietary fatty acid profile influences the composition of skeletal muscle phospholipids in rats. J. Nutr. 1996;126(3):653–662. - PubMed
    1. Bankhead A, III, Magnuson NS, Heckendorn RB. Cellular automaton simulation examining progenitor heirarchy structure effects on mammary ductal carcinoma in situ. J. Theor. Biol. 2007;246(3):491–498. - PubMed

Publication types