. 2012 Apr;194(8):2062-73.
doi: 10.1128/JB.00022-12. Epub 2012 Feb 17.

Heterogeneity in Pseudomonas aeruginosa biofilms includes expression of ribosome hibernation factors in the antibiotic-tolerant subpopulation and hypoxia-induced stress response in the metabolically active population

Affiliations

Heterogeneity in Pseudomonas aeruginosa biofilms includes expression of ribosome hibernation factors in the antibiotic-tolerant subpopulation and hypoxia-induced stress response in the metabolically active population

Kerry S Williamson et al. J Bacteriol. 2012 Apr.

Abstract

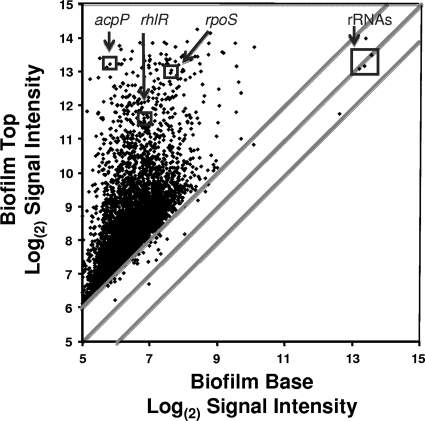
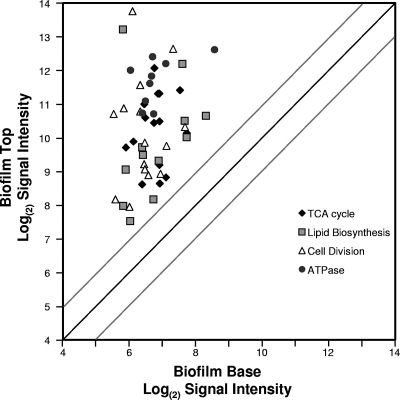
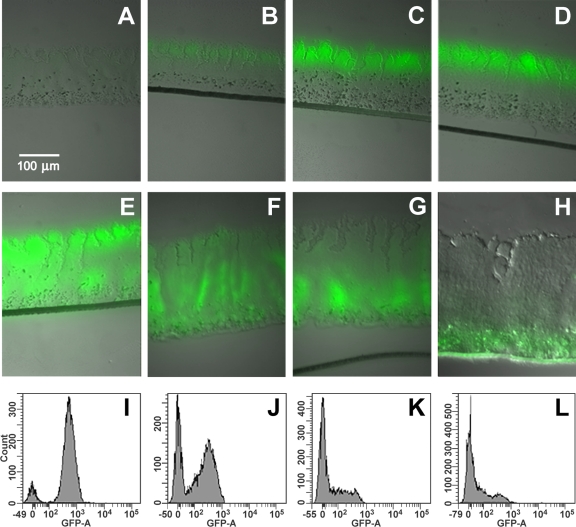
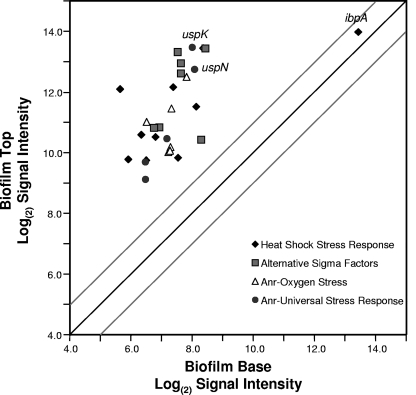
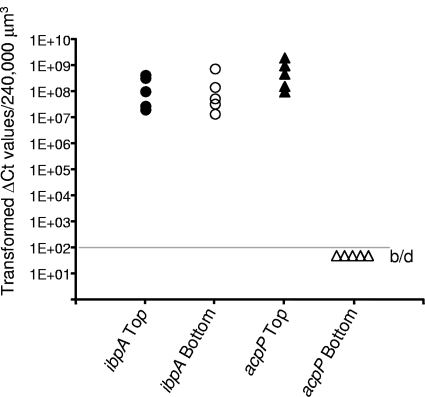
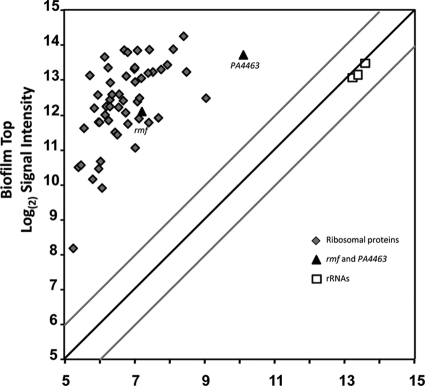
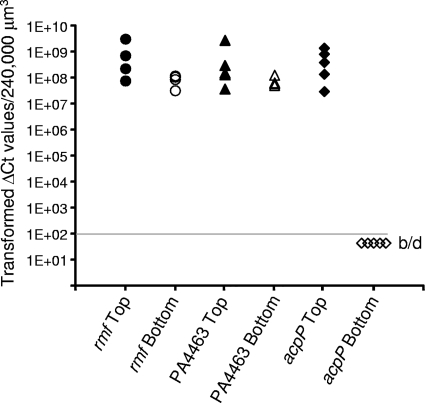
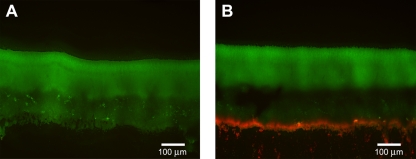
Bacteria growing in biofilms are physiologically heterogeneous, due in part to their adaptation to local environmental conditions. Here, we characterized the local transcriptome responses of Pseudomonas aeruginosa growing in biofilms by using a microarray analysis of isolated biofilm subpopulations. The results demonstrated that cells at the top of the biofilms had high mRNA abundances for genes involved in general metabolic functions, while mRNA levels for these housekeeping genes were low in cells at the bottom of the biofilms. Selective green fluorescent protein (GFP) labeling showed that cells at the top of the biofilm were actively dividing. However, the dividing cells had high mRNA levels for genes regulated by the hypoxia-induced regulator Anr. Slow-growing cells deep in the biofilms had little expression of Anr-regulated genes and may have experienced long-term anoxia. Transcripts for ribosomal proteins were associated primarily with the metabolically active cell fraction, while ribosomal RNAs were abundant throughout the biofilms, indicating that ribosomes are stably maintained even in slowly growing cells. Consistent with these results was the identification of mRNAs for ribosome hibernation factors (the rmf and PA4463 genes) at the bottom of the biofilms. The dormant biofilm cells of a P. aeruginosa Δrmf strain had decreased membrane integrity, as shown by propidium iodide staining. Using selective GFP labeling and cell sorting, we show that the dividing cells are more susceptible to killing by tobramycin and ciprofloxacin. The results demonstrate that in thick P. aeruginosa biofilms, cells are physiologically distinct spatially, with cells deep in the biofilm in a viable but antibiotic-tolerant slow-growth state.


Figures

Fig 1
Fig 1
Microarray analysis of the P. aeruginosa biofilm transcriptome, with the log(2) signal intensity for each gene transcript plotted for the top of the biofilm versus that for the bottom of the biofilm (n = 5 for each gene). For averages and variances of the signal intensity for each gene, see Table S1 in the supplemental material.
Fig 2
Fig 2
Microarray results of mRNA signal intensities of metabolic housekeeping genes plotted for the top of the biofilm versus the those for the bottom of the biofilms. Specific genes are listed in Table S2 in the supplemental material, along with the averages and variances of the microarray results (n = 5). The dark diagonal line is for genes with equal mRNA abundances at the top and bottom of the biofilms. The gray lines show the results of a 2-fold difference in mRNA abundance for the top versus the bottom of the biofilms.
Fig 3
Fig 3
Selective GFP labeling of active and inactive bacteria. (A) Colony biofilm of P. aeruginosa MH475 without induction by arabinose. Colony biofilm after 48 h without arabinose and then induced with 2% arabinose for (B) 4 h, (C) 12 h, or (D) 24 h. (E) Colony biofilm of P. aeruginosa MH475 cultured in the presence of 2% arabinose for 48 h. (E to H) Colony biofilms cultured in the presence of 2% arabinose for 48 h and then transferred to medium without arabinose for an additional (F) 24 h, (G) 36 h, or (H) 48 h. FACS analysis of l-arabinose-cultured biofilms, followed by the removal of arabinose and incubational for an additional (I) 0 h, (J) 24 h, (K) 36 h, (L) 48 h.
Fig 4
Fig 4
Microarray results for mRNA amounts of stress-responsive genes. The signal intensities for individual genes with means and variances are shown in Table S3 in the supplemental material. The dark diagonal line would indicate genes with equal mRNA abundances at the top and bottom of the biofilms. The gray lines show the results of a 2-fold difference in mRNA abundance for the top versus the bottom of the biofilms.
Fig 5
Fig 5
qRT-PCR analysis of ibpA mRNA levels at the top (filled circles) and bottom (open circles) of P. aeruginosa biofilms. Samples used to measure ibpA mRNA were also used to measure acpP mRNA, which showed a high abundance at the top of the biofilms (filled triangles) but was below the limit of detection (b/d) at the bottom of the biofilms (open triangles).
Fig 6
Fig 6
Microarray results for mRNA amounts of ribosomal proteins (diamonds), ribosomal RNAs (squares), and ribosome hibernation factors (triangles). The dark diagonal line would indicate genes with equal mRNA abundances at the top and bottom of the biofilms. The gray lines show the results of a 2-fold difference in mRNA abundance for the top versus the bottom of the biofilms. Means and variances of the signal intensities are shown in Table S5 in the supplemental material.
Fig 7
Fig 7
qRT-PCR analysis of rmf and PA4463 mRNA levels at the top and bottom of P. aeruginosa biofilms. Samples used to measure rmf and PA4463 mRNA were also used to measure acpP mRNA, which showed a high abundance at the top of the biofilms but was below the limit of detection (b/d) at the bottom of the biofilms.
Fig 8
Fig 8
Propidium iodide (PI) staining of P. aeruginosa colony biofilms, Each strain constitutively expressed the GFP from plasmid pMF230 for visualization of the colonies. Cells were stained by placing colony biofilms on filters containing PI for 30 min, as described in Materials and Methods. Biofilms were imaged following cryoembedding and thin sectioning. (A) Very little PI staining was observed for P. aeruginosa PAO1. (B) The P. aeruginosa Δrmf strain consistently showed a band of red fluorescence, indicative of PI uptake, along the bottom of the biofilm. The P. aeruginosa ΔPA4463 strain had variable levels of staining but generally did not stain with PI. PI uptake is often used to indicate cells with compromised cell membranes.

Similar articles

Cited by

References

    1. Alhede M, et al. 2009. Pseudomonas aeruginosa recognizes and responds aggressively to the presence of polymorphonuclear leukocytes. Microbiology 155: 3500– 3508 - PubMed
    1. Allegrucci M, Sauer K. 2007. Characterization of colony morphology variants isolated from Streptococcus pneumoniae biofilms. J. Bacteriol. 189: 2030– 2038 - PMC - PubMed
    1. Alvarez-Ortega C, Harwood CS. 2007. Responses of Pseudomonas aeruginosa to low oxygen indicate that growth in the cystic fibrosis lung is by aerobic respiration. Mol. Microbiol. 65: 153– 165 - PMC - PubMed
    1. Anderl JN, Franklin MJ, Stewart PS. 2000. Role of antibiotic penetration limitation in Klebsiella pneumoniae biofilm resistance to ampicillin and ciprofloxacin. Antimicrob. Agents Chemother. 44: 1818– 1824 - PMC - PubMed
    1. Anwar H, Costerton JW. 1990. Enhanced activity of combination of tobramycin and piperacillin for eradication of sessile biofilm cells of Pseudomonas aeruginosa. Antimicrob. Agents Chemother. 34: 1666– 1671 - PMC - PubMed

Publication types

MeSH terms

Associated data