. 2012 May 15;21(10):2330-40.
doi: 10.1093/hmg/dds052. Epub 2012 Feb 17.

OLIG2 over-expression impairs proliferation of human Down syndrome neural progenitors

Affiliations

OLIG2 over-expression impairs proliferation of human Down syndrome neural progenitors

Jie Lu et al. Hum Mol Genet. .

Abstract

Mental retardation and early Alzheimer's disease (AD) have generally been attributed to progressive neuronal loss in the developing and mature Down syndrome (DS) brain. However, reduced neuronal production during development could also contribute to the smaller brain size and simplified gyral patterning seen in this disorder. Here, we show impairments in proliferation within the ventricular zone (VZ) of early DS fetal cortex and in cultured early passage DS human neural progenitors (HNPs). We find that the reduced proliferative rates correspond temporally with increased expression of the chromosome 21 (HSA21) associated, oligodendrocyte transcription factor OLIG2 at 14-18 weeks gestational age (GA) (period of neurogenesis). Moreover, the DS HNPs adopt more oligodendrocyte-specific features including increased oligodendrocyte marker expression, as well as a reduction in KCNA3 potassium channel expression and function. We further show that OLIG2 inhibition or over-expression regulates potassium channel expression levels and that activation or inhibition of these channels influences the rate of progenitor proliferation. Finally, neural progenitors from Olig2 over-expressing transgenic mice exhibit these same impairments in proliferation and potassium channel expression. These findings suggest that OLIG2 over-expression inhibits neural progenitor proliferation through changes in potassium channel activity, thereby contributing to the reduced neuronal numbers and brain size in DS.


Figures
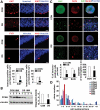
Figure 1.
Figure 1.
Impaired proliferation in DS HNPs. (A) Fluorescence photomicrograph demonstrates a reduction in the cell proliferation marker Ki67 (rhodamine, upper) and G2/M-phase marker PH3 (rhodamine, lower) along the VZ of 18 W GA DS brain when compared with age-matched control. The quantifications from three CON and three DS samples are shown graphically below. (B) Western blot analyses demonstrate a reduction in the proliferation marker PCNA in frontal cortex within several independent 18 W GA DS samples, consistent with the immunofluorescent staining. (C) Neurospheres derived from the VZ of 18 W GA DS and CON frontal cortices and cultured for 1 W show reduction in both BrdU (rhodamine) and Ki67 (fluorescein) labeled progenitors in DS, consistent with the in vivo findings. (Neurospheres were incubated with 20 µm BrdU for 24 h before fixation for staining with antibody. n > 5 neurospheres in each experimental sample, with n > 3 for each GA.) Growth of DS clonal HNPs lines can also be gauged by the size of neurospheres. Quantification of multiple DS samples shows diminished neurosphere size. (D) In the clonal clusters following low density culturing, individual CON clones exhibit larger cell numbers than those of DS. The samples of above tissues are dissected from frontal cortex (see Supplementary Material, Fig. S2B). Scale bars are 25 μm for (A), 200 μm for low magnification and 25 μm for high magnification in (C). Data are represented as mean ± SD, ***P-value < 0.001 by two tailed t-test.
Figure 2.
Figure 2.
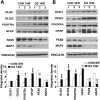
Increased oligodendrocyte progenitor phenotypes in DS HNPs from frontal cortex. (A) Western blot shows increasing expression of oligodendrocyte progenitor (OLIG2, PDGFRA) and glial (GFAP) markers, and decreasing expression of neuronal progenitor marker (PAX6) and neuronal marker (MAP2) in 14 W GA DS frontal cortices compared with CON. No significant change is seen in the oligodendrocyte transcription factor OLIG1. (B) Western blot shows increasing expression of oligodendrocyte progenitor markers (OLIG1, OLIG2, PDGFRA), glia marker GFAP and decreasing expression of neuronal progenitor marker (PAX6) and the neuronal marker MAP2. The decline in neurogenic markers corresponds with a decrease in the proliferation marker PCNA in 18 W GA DS frontal cortices compared with CON (Fig. 1). Quantifications for the western blots are shown graphically below the blots of each age, respectively. Data are represented as mean ± SD, *P-value < 0.05, **P-value < 0.01, ***P-value < 0.001 by two tailed t-test.
Figure 3.
Figure 3.
Decreased voltage-gated potassium channel currents and KCNA3 expression in DS HNPs. (A) Phase contrast images of 1-day cultured CON and DS HNPs (upper panel, arrows indicate the cells normally used for collection of electrophysiological data). Middle panel: whole-cell currents are obtained in the presence of K-Aspartate in the pipette (intracellular) and NaCl bathing solution. Data are obtained and averaged from three CON and three DS HNPs. Whole-cell protocols are applied as indicated in parenthesis. Whole-cell currents are obtained between ±100 mV, either from a holding potential of 0 or −120 mV. Lower panel: whole-cell currents are obtained in the presence of CsCl-TEA (CsCl) in the intracellular compartment, and bathing NaCl. Data are obtained from three CON and three DS HNPs. Whole-cell currents are obtained between ±100 mV, from a holding potential of either 0 or −120 mV. The numbers in parentheses indicate numbers of experiments averaged. Whole-cell currents are slightly higher in at −120 than 0 mV, but not in DS samples. This is also observed by the change in reversal potential only observed after voltage activation for controls, but not DS cells (Table 2). (B) Voltage-activated transient whole-cell currents of HNPs. Representative whole-cell currents are obtained from a CON and DS donors, respectively. Whole-cell currents are obtained between ±100 mV, from a holding potential of −120 mV. Traces are the subtracted values at the various step potentials, respect to remainder currents at 380 mc. (C) Voltage-activated transient conductance of HNPs. Graph shows current-to-voltage relationships from currents obtained in Figure 3A. Transient conductance is observed in KAsp, but not in CsCl dialyzed cells. Values of transient currents are obtained by subtraction of the current at 380 ms at the various stepping potentials. As observed in the respective tracings, currents from CON cells were higher from those of DS cells. (D) Western blot shows decreasing of one of the voltage-gated potassium channels KCNA3 expression in DS frontal cortical tissue. Data are represented as mean ± SD, *P-value < 0.05 by two tailed t-test.
Figure 4.
Figure 4.
OLIG2 inhibits KCNA3 expression and proliferation in HNPs. (A) Western blot analyses show that over-expression of OLIG2 in HNPs infected with lentivirus carrying OLIG2 construct for 3 days dose-dependently inhibits PCNA (G1/S phase proliferation marker) and KCNA3 expression compared with cells infected with lentivirus carrying ZsGreen construct alone. (B) Down regulation of KCNA3 and PCNA is similarly shown in the cortex of E14.5 Olig2 transgenic mouse by western blot studies. (C) Lentiviral infection with human OLIG2 shRNA for 3 days leads to inhibition of OLIG2 protein expression and reverses the proliferation and KCNA3 changes in DS HNPs, as shown by western blot analyses. (D) Fluorescence photomicrographs of individual DS neurospheres (CON) and DS neurospheres infected with lentivirus carrying GFP-tagged OLIG2 shRNA (labeled cells in fluoroscein), immunostained for OLIG1/2 or KCNA3 expression (rhodamine) and counterstained with the Hoescht nuclear stain. Three days following infection, loss of OLIG2 immunostaining (rhodamine) can be seen in infected cells (fluoroscein, upper panel) when compared with infection with GFP vector alone. The loss of OLIG2 further enhances OLIG1 expression (middle panel) and KCNA3 expression (lower panel). Lower magnification fluorescence photomicrographs of individual DS neurospheres infected with OLIG2 shRNA and immunostained for KCNA3 (rhodamine, top half, lower panel) demonstrate an overall increase in rhodamine fluorescent intensity. At higher magnification (lower half, lower panel), infected cells show brighter levels of rhodamine KCNA3 fluorescence than uninfected cells. Quantification for the percentage of positive OLIG1/2 cells and KCNA3 fluorescent intensity are shown graphically below. Scale bar is 25 μm in the high magnification and 200 μm in the low magnification images in (D). Data are represented as mean ± SD, *P-value < 0.05, **P-value < 0.01, ***P-value < 0.001 by two tailed t-test and one-way ANOVA.
Figure 5.
Figure 5.
Inhibition and activation of voltage-gated potassium channels affect proliferation rates in cultured HNPs. (A) An inhibition in proliferation of HNPs as measured by BrdU and Ki67 staining is seen following treatment with voltage-gated potassium channel antagonists TEA (1 mm) or KCNA3-specific antagonist ShK (0.1 nm) for 24 h. A fluorescence photomicrograph is shown in Supplementary Material, Figure S5. (B) A dose-dependent inhibition in proliferation of HNPs as measured by BrdU and Ki67 staining is seen following treatment with ShK for 24 h. (C) Similar effects of TEA and ShK on inhibiting proliferation are appreciated in mouse neuroprogenitor cells for 24 h of treatments. (D) Pre-treatment with low dose glutamate (1 μm) which has been shown to activate voltage-gated potassium channels for 24 h stimulates proliferation in DS HNPs, and it could be blocked by ShK pretreatment (1 nm), as measured by BrdU and Ki67 immunostaining. Data are represented as mean ± SD, *P-value < 0.05, **P-value < 0.01, ***P-value < 0.001 by two tailed t-test and one-way ANOVA.

Similar articles

Cited by

References

    1. Golden J.A., Hyman B.T. Development of the superior temporal neocortex is anomalous in trisomy 21. J. Neuropathol. Exp. Neurol. 1994;53:513–520. - PubMed
    1. Guidi S., Bonasoni P., Ceccarelli C., Santini D., Gualtieri F., Ciani E., Bartesaghi R. Neurogenesis impairment and increased cell death reduce total neuron number in the hippocampal region of fetuses with Down syndrome. Brain Pathol. 2008;18:180–197. - PMC - PubMed
    1. Esposito G., Imitola J., Lu J., De Filippis D., Scuderi C., Ganesh V.S., Folkerth R., Hecht J., Shin S., Iuvone T., et al. Genomic and functional profiling of human Down syndrome neural progenitors implicates S100B and aquaporin 4 in cell injury. Hum. Mol. Genet. 2008;17:440–457. - PubMed
    1. Lu J., Esposito G., Scuderi C., Steardo L., Delli-Bovi L.C., Hecht J.L., Dickinson B.C., Chang C.J., Mori T., Sheen V. S100B and APP promote a gliocentric shift and impaired neurogenesis in down syndrome neural progenitors. PLoS ONE. 2011;6:e22126. - PMC - PubMed
    1. Contestabile A., Fila T., Ceccarelli C., Bonasoni P., Bonapace L., Santini D., Bartesaghi R., Ciani E. Cell cycle alteration and decreased cell proliferation in the hippocampal dentate gyrus and in the neocortical germinal matrix of fetuses with Down syndrome and in Ts65Dn mice. Hippocampus. 2007;17:665–678. - PubMed

Publication types

MeSH terms

Substances