. 2012 Apr 6;287(15):12070-82.
doi: 10.1074/jbc.M111.316463. Epub 2012 Feb 16.

Allosteric modulator ORG27569 induces CB1 cannabinoid receptor high affinity agonist binding state, receptor internalization, and Gi protein-independent ERK1/2 kinase activation

Affiliations

Allosteric modulator ORG27569 induces CB1 cannabinoid receptor high affinity agonist binding state, receptor internalization, and Gi protein-independent ERK1/2 kinase activation

Kwang H Ahn et al. J Biol Chem. .

Abstract

The cannabinoid receptor 1 (CB1), a member of the class A G protein-coupled receptor family, is expressed in brain tissue where agonist stimulation primarily activates the pertussis toxin-sensitive inhibitory G protein (G(i)). Ligands such as CP55940 ((1R,3R,4R)-3-[2-hydroxy-4-(1,1-dimethylheptyl)phenyl]-4-(3- hydroxypropyl)cyclohexan-1-ol) and Δ(9)-tetrahydrocannabinol are orthosteric agonists for the receptor, bind the conventional binding pocket, and trigger G(i)-mediated effects including inhibition of adenylate cyclase. ORG27569 (5-chloro-3-ethyl-1H-indole-2-carboxylic acid [2-(4-piperidin-1-yl-phenyl)ethyl]amide) has been identified as an allosteric modulator that displays positive cooperativity for CP55940 binding to CB1 yet acts as an antagonist of G protein coupling. To examine this apparent conundrum, we used the wild-type CB1 and two mutants, T210A and T210I (D'Antona, A. M., Ahn, K. H., and Kendall, D. A. (2006) Biochemistry 45, 5606-5617), which collectively cover a spectrum of receptor states from inactive to partially active to more fully constitutively active. Using these receptors, we demonstrated that ORG27569 induces a CB1 receptor state that is characterized by enhanced agonist affinity and decreased inverse agonist affinity consistent with an active conformation. Also consistent with this conformation, the impact of ORG27569 binding was most dramatic on the inactive T210A receptor and less pronounced on the already active T210I receptor. Although ORG27569 antagonized CP55940-induced guanosine 5'-3-O-(thio)triphosphate binding, which is indicative of G protein coupling inhibition in a concentration-dependent manner, the ORG27569-induced conformational change of the CB1 receptor led to cellular internalization and downstream activation of ERK signaling, providing the first case of allosteric ligand-biased signaling via CB1. ORG27569-induced ERK phosphorylation persisted even after pertussis toxin treatment to abrogate G(i) and occurs in HEK293 and neuronal cells.


Figures
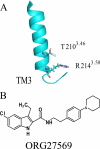
FIGURE 1.
FIGURE 1.
Structure of TM3 of human CB1 receptor and ORG27569. The relative positions of residues Thr-2103.46 and Arg-2143.50 of CB1 are shown on a helical ribbon (A). Note Thr-2103.46 is one helical turn N-terminal to Arg-2143.50 of the DRY motif. The chemical structure of the allosteric modulator ORG27569 is shown (B).
FIGURE 2.
FIGURE 2.
Effect of ORG27569 on [3H]CP55940 binding. Binding assays were performed using the CB1 agonist [3H]CP55940 on membrane preparations from HEK293 cells expressing the wild-type (●), T210I (△), and T210A (■) receptors as described under “Experimental Procedures” (A). Each data point represents the mean ± S.E. (error bars) of four independent experiments performed in duplicate. Binding parameters of the allosteric modulator ORG27569 binding to CB1 receptors are shown (B).
FIGURE 3.
FIGURE 3.
Effect of ORG27569 on stimulation of [35S]GTPγS binding to HEK293 cell membranes expressing CB1 wild-type, T210I, or T210A receptors. Dose-response curves for CP55940-induced [35S]GTPγS binding in membrane preparations of HEK293 cells expressing the wild-type receptor in the absence (○) or presence of 0.1 (●), 0.3 (□), 1 (■), and 10 μm (▿) ORG27569 are shown (A). The basal level of [35S]GTPγS binding was measured for the wild-type, T210I, and T210A receptors (B). Inhibition of [35S]GTPγS binding by SR141716A and ORG27569 was tested at the indicated concentrations for each receptor. Data are presented as specific binding of GTPγS to the membranes. Nonspecific binding was determined in the presence of 10 μm unlabeled GTPγS. Each data point represents the mean ± S.E. (error bars) of at least three independent experiments performed in duplicate. The solid line indicates the level of non CB1-mediated GTPγS binding obtained from [35S]GTPγS binding to the mock-transfected membrane sample.
FIGURE 4.
FIGURE 4.
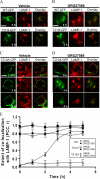
Cellular internalization of CB1 receptors upon treatment with allosteric modulator ORG27569. HEK293 cells expressing the CB1 wild type-GFP (A and B, top) and T210I-GFP receptors (A and B, bottom) were incubated with vehicle alone (0.03% DMSO) or 10 μm ORG27569 for 3 h as indicated (A). HEK293 cells expressing the CB1 T210A-GFP receptor were incubated with vehicle alone (0.03% DMSO) (C) or 10 μm ORG27569 (D) for 0, 3, and 4 h as indicated. After incubation, cells were washed and fixed as described under “Experimental Procedures.” Localization of GFP-tagged wild-type, T210I, and T210A receptors (green; left) and the late endosome/lysosome marker LAMP-1 (red; middle) and an overlay of the fluorescence images (yellow; right) are shown. Images are representative of at least three independent transfections. Scale bar, 15 μm (white bar; see A). The extent of co-localization quantified using the intensity correlation analysis is shown (E). Twelve images of each condition were analyzed (n = 12). The PCC (r), which provides an estimate of the goodness of co-localization, was calculated at each time point. PCC (r) is presented as the mean ± S.E. (error bars).
FIGURE 5.
FIGURE 5.
Comparison of agonist-induced cellular internalization of CB1 T210A receptor in absence or presence of ORG27569. Cells expressing the CB1 T210A-GFP receptor were treated with 0.5 μm CP55940 in the presence of vehicle alone (0.03% DMSO) (A) or ORG27569 (B) for the times (m represents minutes) indicated before fixation. Scale bar, 15 μm (white bar; see top images). Localization of T210A-GFP receptor (green; left) and LAMP-1 (red; middle) and an overlay of the fluorescence images (yellow; right) are shown. Images are representative of at least three independent transfections. The extent of co-localization of CB1 and LAMP-1 was quantified using the intensity correlation analysis (C) (n = 10). The PCC (r) was calculated at each time point. PCC (r) is presented as the mean ± S.E. (error bars).
FIGURE 6.
FIGURE 6.
Effect of ORG27569 on MAPK signaling. HEK293 cells expressing CB1 wild-type (A and D), T210I (B and E), and T210A (C and F) receptors were exposed to ORG27569 (10 μm), CP55940 (0.5 μm), or both (CP+ORG) for 0, 5, 10, or 15 min as indicated. Cell lysates were separated by SDS-PAGE and analyzed by Western blots probed with phospho-ERK1/2 (p-ERK1/2) or phospho-JNK (p-JNK) antibody followed by an HRP-conjugated anti-rabbit secondary antibody. Total levels of ERK1/2 and JNK were also detected for comparison using ERK1/2 and JNK antibodies, respectively. Immunoreactive signals were visualized by a chemiluminescent substrate system as described under “Experimental Procedures.” The levels of phosphorylation for the untransfected HEK293 cells are shown as a control. Representative blots of phosphorylated (p-JNK and p-ERK1/2) and total (JNK and ERK1/2) MAPK signals are depicted for each receptor. Note that the two bands correspond to the predominant isoforms, p46 (JNK1) and p54 (JNK2) for JNK signaling and p42 (ERK2) and p44 (ERK1) for ERK signaling. Graphs provide the quantified JNK and ERK1/2 phosphorylation levels deduced from at least three experiments. Data are expressed as a -fold increase above the basal level of phosphorylation. Data represent the mean ± S.E. (error bars) of at least three independent experiments. Statistical significance of the differences was assessed using one-way analysis of variance and Bonferroni's post hoc test: *, p < 0.05; **, p < 0.01; and ***, p < 0.001.
FIGURE 7.
FIGURE 7.
CP55940- and ORG27569-promoted MAPK signaling in hippocampal neuronal cells. Rat hippocampal neurons endogenously expressing CB1 were exposed to CP55940 (0.5 μm) or ORG27569 (10 μm) for 5 min. Cell lysates were resolved by SDS-PAGE and JNK (A) and ERK1/2 (B) phosphorylation was detected as described in Fig. 5. Representative blots of phosphorylated (p-JNK and p-ERK1/2) and total (JNK and ERK1/2) MAPK signals are depicted. Graphs show the quantified JNK and ERK1/2 phosphorylation levels deduced from three experiments (C). Data are expressed as the -fold increase above basal levels of phosphorylation. Data represent the mean ± S.E. (error bars) of at least three independent experiments. Statistical significance of the differences was assessed using one-way analysis of variance and Bonferroni's post-hoc test; *, p < 0.05; **, p < 0.01; ***, p < 0.001.
FIGURE 8.
FIGURE 8.
Pertussis toxin sensitivity of JNK and ERK1/2 phosphorylation by ORG27569. HEK293 cells expressing CB1 receptors were incubated with vehicle or 5 ng/ml PTX for 18 h and treated with CP55940 (0.5 μm) or ORG27569 (10 μm) for 5 and 15 min as indicated. Equal amounts of cell lysate were resolved by SDS-PAGE, and JNK (A) and ERK1/2 (B) phosphorylation was detected as described in Fig. 5. Representative blots of phosphorylated (p-JNK and p-ERK1/2) and total (JNK and ERK1/2) MAPK signals are depicted for each receptor. Graphs show the quantified JNK and ERK1/2 phosphorylation levels deduced from four experiments. Data are expressed as the -fold increase above the basal level of phosphorylation. Data represent the mean ± S.E. (error bars) of at least three independent experiments. Statistical significance of the differences was assessed using one-way analysis of variance and Bonferroni's post-hoc test: **, p < 0.01; and ***, p < 0.001.

References

    1. Shukla A. K., Violin J. D., Whalen E. J., Gesty-Palmer D., Shenoy S. K., Lefkowitz R. J. (2008) Distinct conformational changes in β-arrestin report biased agonism at seven-transmembrane receptors. Proc. Natl. Acad. Sci. U.S.A. 105, 9988–9993 - PMC - PubMed
    1. Shukla A. K., Xiao K., Lefkowitz R. J. (2011) Emerging paradigms of β-arrestin-dependent seven transmembrane receptor signaling. Trends Biochem. Sci. 36, 457–469 - PMC - PubMed
    1. Violin J. D., Lefkowitz R. J. (2007) β-Arrestin-biased ligands at seven-transmembrane receptors. Trends Pharmacol. Sci. 28, 416–422 - PubMed
    1. Johnson G. L., Lapadat R. (2002) Mitogen-activated protein kinase pathways mediated by ERK, JNK, and p38 protein kinases. Science 298, 1911–1912 - PubMed
    1. Song X., Coffa S., Fu H., Gurevich V. V. (2009) How does arrestin assemble MAPKs into a signaling complex? J. Biol. Chem. 284, 685–695 - PMC - PubMed

Publication types

MeSH terms

Substances

LinkOut - more resources