. 2012 Mar 16;110(6):818-30.
doi: 10.1161/CIRCRESAHA.111.259663. Epub 2012 Feb 16.

CIP, a cardiac Isl1-interacting protein, represses cardiomyocyte hypertrophy

Affiliations

CIP, a cardiac Isl1-interacting protein, represses cardiomyocyte hypertrophy

Zhan-Peng Huang et al. Circ Res. .

Abstract

Rationale: Mammalian heart has minimal regenerative capacity. In response to mechanical or pathological stress, the heart undergoes cardiac remodeling. Pressure and volume overload in the heart cause increased size (hypertrophic growth) of cardiomyocytes. Whereas the regulatory pathways that activate cardiac hypertrophy have been well-established, the molecular events that inhibit or repress cardiac hypertrophy are less known.

Objective: To identify and investigate novel regulators that modulate cardiac hypertrophy.

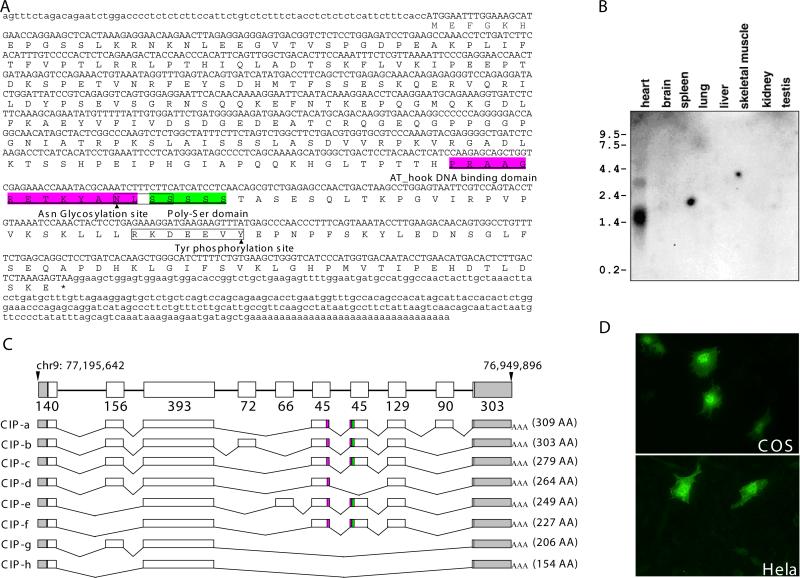
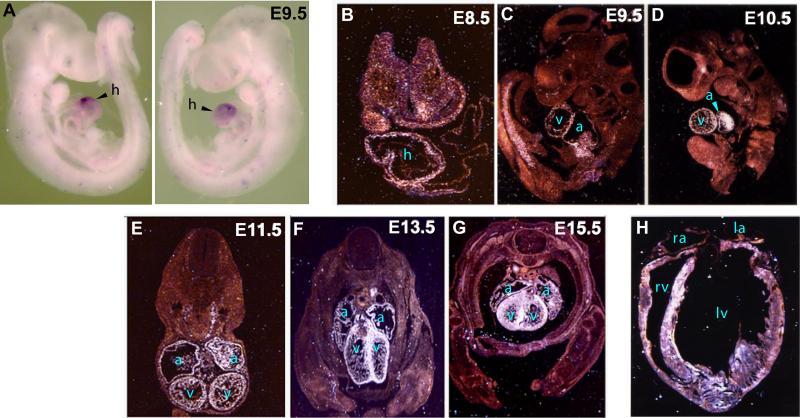
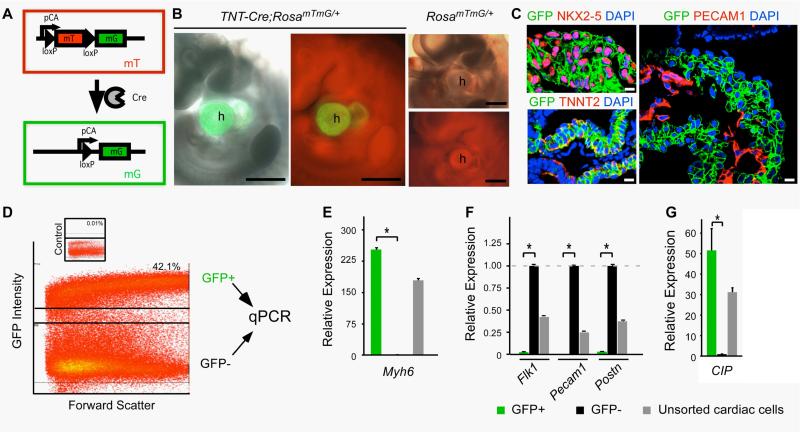
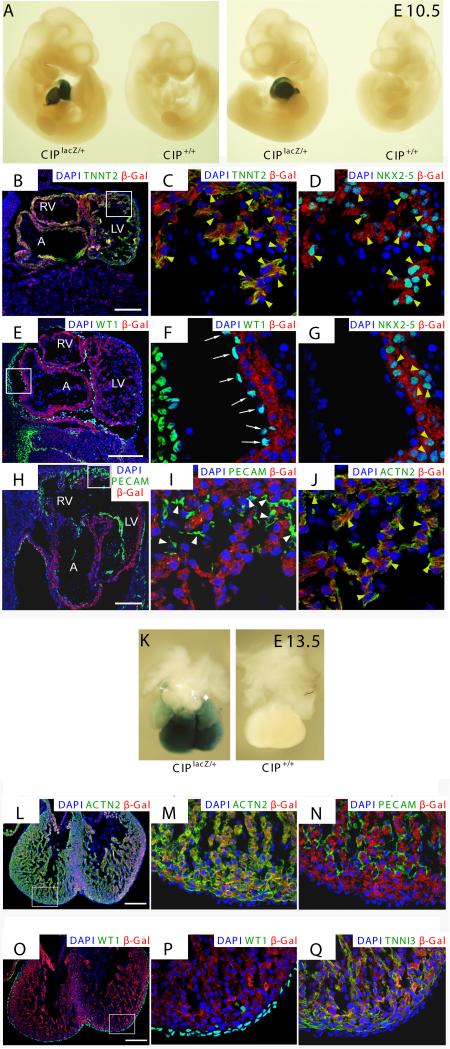
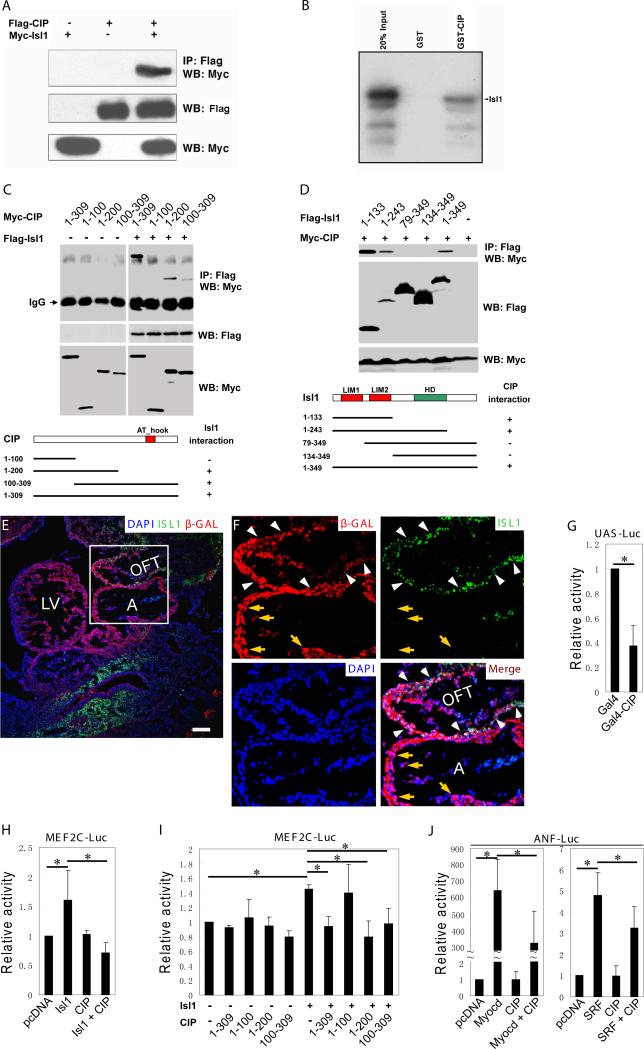
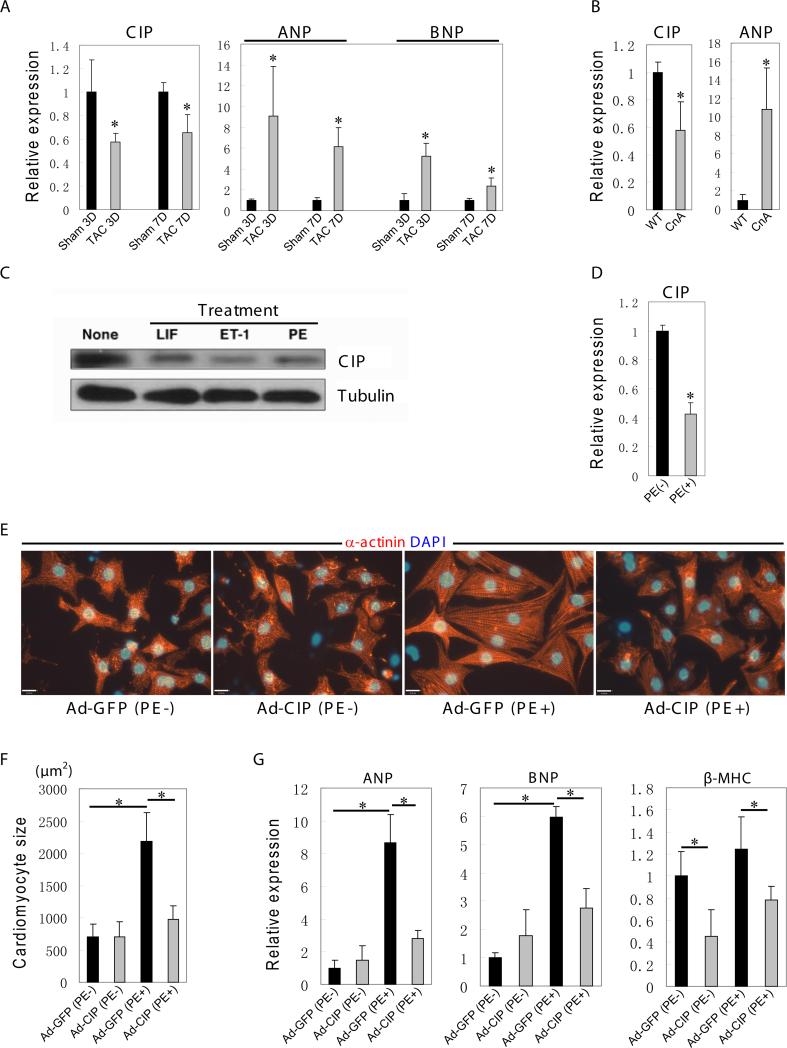
Methods and results: Here, we report the identification, characterization, and functional examination of a novel cardiac Isl1-interacting protein (CIP). CIP was identified from a bioinformatic search for novel cardiac-expressed genes in mouse embryonic hearts. CIP encodes a nuclear protein without recognizable motifs. Northern blotting, in situ hybridization, and reporter gene tracing demonstrated that CIP is highly expressed in cardiomyocytes of developing and adult hearts. Yeast two-hybrid screening identified Isl1, a LIM/homeodomain transcription factor essential for the specification of cardiac progenitor cells in the second heart field, as a cofactor of CIP. CIP directly interacted with Isl1, and we mapped the domains of these two proteins, which mediate their interaction. We show that CIP represses the transcriptional activity of Isl1 in the activation of the myocyte enhancer factor 2C. The expression of CIP was dramatically reduced in hypertrophic cardiomyocytes. Most importantly, overexpression of CIP repressed agonist-induced cardiomyocyte hypertrophy.

Conclusions: Our studies therefore identify CIP as a novel regulator of cardiac hypertrophy.


Figures

Figure 1
Figure 1. Identification of the CIP gene
(A) Nucleotide sequences and deduced amino acid sequences. Nucleotides for open reading frame (ORF) are showed in uppercase; Nucleotides for both 5’ and 3’ untranslated regions (UTRs) are showed in lowercase. The corresponding amino acids (in single letter code) are shown below. Amino acids underlined indicate the putative AT_hook domain and poly-Ser domain. The predicted amino acid modifications are also indicated and their recognition motifs are shown in boxes. (B) Northern blotting analysis of CIP expression using RNAs of different tissues from adult mice. (C) Gene structure and alternative splicing of the mouse CIP gene. Empty boxes mark ORF, gray boxes indicate UTR. The color boxes in alternative splicing variants indicate putative domains shown in Figure 1A. (D) CIP is a nuclear protein. Immunochemistry detecting the nuclear localization of the FLAG-CIP fusion proteins in transfected COS and Hela cells.
Figure 2
Figure 2. Expression of CIP gene in embryonic and adult mouse tissues
(A) Whole mount in situ hybridization detecting CIP transcript expression in E9.5 mouse embryos. In situ hybridization detecting CIP transcript expression on sections of staged mouse embryos (B-G) and in an adult mouse heart (H). (B, E, F, G) transverse sections; (C, D, H) sagittal sections. h: heart; a: atrium; la: left atrium; lv: left ventricle; ra: right atrium; rv: right ventricle; v: ventricle.
Figure 3
Figure 3. Quantitative RT-PCR analyses of CIP expression in cardiomyocytes of mouse embryos
(A) Schematic of the RosamTmG/+ reporter system. In the presence of Cre recombinase, which deletes the mT cassette, the expression of membranous tomato red (mT) turns into membranous green fluorescence protein (mG). (B) When the RosamTmG/+ reporter line was crossed with a cardiomyocyte specific Cre line (TNT-Cre), membranous GFP is detected in E10.5 heart (h) whereas there is no green signal in the heart of control littermate. Bar = 500 μm. (C) Membranous GFP is detected in NKX2.5 positive and TNNT2 positive myocardium, but not the PECAM1 positive endocardium. Bar = 10 μm. (D) FACS isolation of GFP positive and negative cell populations from TNT-Cre; RosamTmG/+ hearts. Insert shows that less than 0.01% GFP positive cells were found in the hearts of control littermates. (E) GFP-positive population is highly enriched for cardiomyocyte specific marker Myh6, documented by quantitative RT-PCR assays. (F) GFP-positive population expresses very low level of endothelial marker Flk1 or Pecam1, and fibrotic tissue marker Postn, indicating the specificity of cell sorting. (G) CIP is highly expressed in the GFP-positive cardiomyocytes, but not in GFP-negative non-cardiomyocytes. Expression in GFP negative population is set as 1. * P<0.01, three embryos were used (n=3) for analysis in each group.
Figure 4
Figure 4. Characterization of CIP expression using a LacZ reporter gene in mouse embryos
(A) Whole mount β-gal staining of mouse E10.5 embryos harboring a LacZ cassette inserted in the CIP locus (CIPlacZ/+), or the control (CIP+/+). Positive β-gal staining is only detected in the heart. (B-J) Immunohistochemistry using indicated antibodies on tissue sections of E10.5 CIPlacZ/+ embryo. Note that CIP positive cells (marked by antibodies against the β-gal and is in red) overlay with Nkx2-5 (D, G), cardiac α-actin (ACTN2) (J) and cardiac troponin T (TNNT2) (B, C) positive cardiomyocytes (yellow arrowheads) but not that of WT1-positive epicardium (white arrows) (E, F) nor PECAM-positive fibroblasts (white arrowheads) (H, I). DAPI (blue) staining marks the nucleus. (K) Whole mount β-gal staining of mouse E13.5 embryonic hearts harboring a LacZ cassette inserted in the CIP locus (CIPlacZ/+), or the control (CIP+/+). (L-Q) Immunohistochemistry using indicated antibodies on tissue sections of E13.5 CIPlacZ/+ embryo. Note that CIP positive cells (marked by antibodies against the β-gal) overlay with cardiac α-actin (ACTN2) and cardiac troponin T (TNNT2) positive cardiomyocytes not that of WT1 positive epicardium, nor PECAM positive fibroblasts. DAPI staining marks the nucleus. (B, E, H, bar=100 μm; C, D, F, G, I, J, bar=10 μm; L, O, bar=200 μm, M, N, P, Q, bar=40 μm. Data are presented as representative images derived from >3 embryos. A, atrium; LV, left ventricle; RV, right ventricle.
Figure 5
Figure 5. CIP interacts with Isl1 and represses its transcription activity
(A) Co-immunoprecipitation assays showing the interaction between Flag-tagged CIP and Myc-tagged Isl1. HEK-293T cells were co-transfected Flag-CIP, Myc-Isl1, or both. Anti-Flag antibody was used to immunoprecipitate (IP) cell extracts and anti-Myc antibody was used in Western blot (WB) to detect Myc-Isl1 protein in the complex. 10% cell lysate was used as input to demonstrate the expression of tagged proteins (button two panels). (B) In vitro GST-fusion protein pull down assays showing the direct interaction between CIP and Isl1. Isl1 protein was synthesized in vitro and labeled with S-35. GST-CIP protein, but not GST protein, pulled down S-35 labeled Isl1. 20% of labeled Isl1 protein was load as control (Input). (C) Map the interaction domains of the CIP protein that mediate the interaction between Isl1 and CIP using co-immunoprecipitation assays. HEK-293T cells were co-transfected Flag-Isl1, Myc-CIP full-length (1-309) or indicated truncated mutants, or both. Anti-Flag antibody was used to immunoprecipitate (IP) cell extracts and anti-Myc antibody was used in Western blot (WB) to detect Myc-CIP protein in the complex. 10% cell lysate was used as input to demonstrate the expression of tagged proteins (lower two panels). The interaction domains are summarized in the bottom diagram. (D) Map the interaction domains of Isl1 proteins which mediate the interaction between Isl1 and CIP using co-immunoprecipitation assays. HEK-293T cells were co-transfected Myc-CIP, Flag-Isl1 full-length (1-349) or indicated truncated mutants, or both. Anti-Flag antibody was used to immunoprecipitate (IP) cell extracts and anti-Myc antibody was used in Western blot (WB) to detect Myc-CIP protein in the complex. 10% cell lysate was used as input to demonstrate the expression of tagged proteins (lower two panels). The interaction domains are summarized in the bottom diagram. (E) Isl1 and CIP are co-expressed in cardiomyocytes of outflow tract of mouse embryos. Immunohistochemistry to demonstrate that Isl1 (green) and β-gal positive CIP (red) expressing cells are co-located in the cardiomyocytes of outflow tract (OFT) of E10.5 mouse embryos (arrowheads). DAPI staining marks the nucleus. Bar = 50 μm. A, atrium; LV, left ventricle; OFT, outflow tract. (F) Enlargement of boxed area in (E) to show that Isl1 and CIP expression is overlapped in the OFT cardiomyocytes (white arrowheads). The expression of Isl1 (green), CIP (as marked by β-gal positive cells, red) DAPI (blue) and merged images were shown. Isl1 and CIP positive cells were indicated by white arrowheads. Note that Isl1 is not expressed in the cardiomyocytes of atrium where CIP is expressed (yellow arrows). (G) CIP is a transcriptional repressor. HEK293T cells were transiently transfected with expression vectors encoding the CIP fused to GAL4 (1–147) and the pL8G5-luciferase reporter, which contains binding sites for the GAL4 DNA binding domain. Luciferase activity is expressed as relative activity in which the control was assigned a value of 1. Data represent the mean ± s.d. from at least three independent experiments in triplicate. *P<0.05. (H) CIP represses the transcription activity of Isl1. MEF2C enhancer-luciferase reporter was co-transfected with indicated expression plasmids in HEK293T cells and luciferase activity was measured. Results were presented as relative luciferase activity in which the control was assigned a value of 1. Data represent the mean ± s.d. from at least three independent experiments in triplicate. *P<0.05. (I) Define the domains of the CIP protein that mediate the repression of Isl1 transcription activity. MEF2C enhancer-luciferase reporter was co-transfected with indicated expression plasmids (full-length isl1, full-length or truncated CIP mutants) in HEK293T cells and luciferase activity was measured. Results were presented as relative luciferase activity in which the control was assigned a value of 1. Data represent the mean ± s.d. from at least three independent experiments in triplicate. *P<0.05. (J) CIP represses myocardin- and SRF-mediated transactivation of the ANF-luciferase reporter. The ANF-luciferase reporter was co-transfected with indicated expression plasmids in HEK293T cells and luciferase activity was measured. Results were presented as relative luciferase activity in which the control was assigned a value of 1. Data represent the mean ± s.d. from at least three independent experiments in triplicate. *P<0.05.
Figure 6
Figure 6. CIP represses cardiomyocyte hypertrophy
(A) Gene expression of CIP and hypertrophic marker, ANP and BNP, determined by qPCR in heart samples from Sham group and Transverse Aortic Constriction (TAC) group at two different time point (3 days and 7 days). n=4. (B) Gene expression of CIP and hypertrophic marker ANP determined by qPCR in heart samples from 1 month old Myh6-calcineurin transgenic mice (CnA) and control littermates (WT). n=3. (C) Western blotting analysis showing decreased expression of CIP proteins in neonatal rat cardiomyocytes, which were induced to develop hypertrophy by different hypertrophic agonists in vitro. None treated sample serves as a control. LIF, leukemia inhibitory factor; ET-1, Endothelin-1; PE, phenylephrine. (D) Quantitative RT-PCR showing CIP expression in rat neonatal cardiomyocytes with or without phenylephrine (PE) treatment. *P<0.05. (E) CIP represses PE-induced hypertrophy in neonatal cardiomyocytes. Representative images of cardiomyocytes infected with adenoviral-CIP (ad-CIP) or adenoviral-GFP (ad-GFP) (to serve as controls) and treated with phenylephrine (PE) (or without treatment to serve as controls). Anti α-actinin antibodies were used to mark cardiomyocytes (red). DAPI marks nucleus. Bar = 21 μm. (F) Quantitative analysis of cardiomyocyte cell size. ~300 cells positive for α-actinin from each treatment were randomly chosen for surface area measurement. *P<0.05. (G) Quantitative RT-PCR showing the downregulation of PE-induced expression of hypertrophic marker ANP, BNP and β-MHC when CIP was overexpressed in neonatal cardiomyocytes. n=4. *P<0.05. ANP, atrial natriuretic peptide; BNP, brain natriuretic peptide; β-MHC, β-myosin heavy chain.

Comment in

Similar articles

Cited by

References

    1. Olson EN. A decade of discoveries in cardiac biology. Nat Med. 2004;10(5):467–474. - PubMed
    1. Musunuru K, Domian IJ, Chien KR. Stem cell models of cardiac development and disease. Annu Rev Cell Dev Biol. 26:667–687. - PMC - PubMed
    1. Komuro I, Izumo S. Csx: a murine homeobox-containing gene specifically expressed in the developing heart. Proc Natl Acad Sci U S A. 1993;90(17):8145–8149. - PMC - PubMed
    1. Lyons I, Parsons LM, Hartley L, Li R, Andrews JE, Robb L, Harvey RP. Myogenic and morphogenetic defects in the heart tubes of murine embryos lacking the homeo box gene Nkx2-5. Genes Dev. 1995;9(13):1654–1666. - PubMed
    1. Lints TJ, Parsons LM, Hartley L, Lyons I, Harvey RP. Nkx-2.5: a novel murine homeobox gene expressed in early heart progenitor cells and their myogenic descendants. Development. 1993;119(3):969. - PubMed

Publication types

MeSH terms