Impaired antioxidant defence and accumulation of oxidative stress in caspase-2-deficient mice
- PMID: 22343713
- PMCID: PMC3392626
- DOI: 10.1038/cdd.2012.13
Impaired antioxidant defence and accumulation of oxidative stress in caspase-2-deficient mice
Abstract
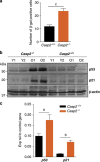
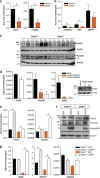
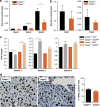
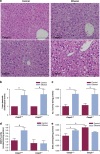
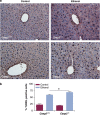
Caspase-2 has been implicated in apoptosis and in non-apoptotic processes such as cell cycle regulation, tumor suppression and ageing. Using caspase-2 knockout (casp2(-/-)) mice, we show here that the putative anti-ageing role of this caspase is due in part to its involvement in the stress response pathway. The old casp2(-/-) mice show increased cellular levels of oxidized proteins, lipid peroxides and DNA damage, suggesting enhanced oxidative stress. Furthermore, murine embryonic fibroblasts from casp2(-/-) mice showed increased reactive oxygen species generation when challenged with pro-oxidants. Reduced activities of antioxidant enzymes glutathione peroxidase (GSH-Px) and superoxide dismutase (SOD) were observed in the old casp2(-/-) mice. Interestingly, in the old casp2(-/-) animals expression of FoxO1 and FoxO3a was significantly reduced, whereas p21 levels and the number of senescent hepatocytes were elevated. In contrast to young wild-type mice, the casp2(-/-) animals fed an on ethanol-based diet failed to show enhanced GSH-Px and SOD activities. Thus, caspase-2, most likely via FoxO transcription factors, regulates the oxidative stress response in vivo.
Figures


Similar articles
-
Loss of caspase-2 accelerates age-dependent alterations in mitochondrial production of reactive oxygen species.Biogerontology. 2013 Apr;14(2):121-30. doi: 10.1007/s10522-013-9415-x. Epub 2013 Mar 16. Biogerontology. 2013. PMID: 23504374 Free PMC article.
-
Caspase-2 protects against oxidative stress in vivo.Oncogene. 2015 Sep 17;34(38):4995-5002. doi: 10.1038/onc.2014.413. Epub 2014 Dec 22. Oncogene. 2015. PMID: 25531319
-
Differentiation of human adipose-derived stem cells into fat involves reactive oxygen species and Forkhead box O1 mediated upregulation of antioxidant enzymes.Stem Cells Dev. 2013 Mar 15;22(6):878-88. doi: 10.1089/scd.2012.0306. Epub 2012 Nov 12. Stem Cells Dev. 2013. PMID: 23025577 Free PMC article.
-
Tumor suppressor genes and ROS: complex networks of interactions.Free Radic Biol Med. 2012 Jan 1;52(1):7-18. doi: 10.1016/j.freeradbiomed.2011.09.035. Epub 2011 Oct 6. Free Radic Biol Med. 2012. PMID: 22019631 Review.
-
Significance of selected antioxidant enzymes in cancer cell progression.Pol J Pathol. 2014 Oct;65(3):167-75. doi: 10.5114/pjp.2014.45779. Pol J Pathol. 2014. PMID: 25372413 Review.
Cited by
-
Caspase-2 and the oxidative stress response.Mol Cell Oncol. 2015 Jan 23;2(4):e1004956. doi: 10.1080/23723556.2015.1004956. eCollection 2015 Oct-Dec. Mol Cell Oncol. 2015. PMID: 27308499 Free PMC article.
-
Loss of caspase-2 accelerates age-dependent alterations in mitochondrial production of reactive oxygen species.Biogerontology. 2013 Apr;14(2):121-30. doi: 10.1007/s10522-013-9415-x. Epub 2013 Mar 16. Biogerontology. 2013. PMID: 23504374 Free PMC article.
-
N-n-Butyl Haloperidol Iodide, a Derivative of the Anti-psychotic Haloperidol, Antagonizes Hypoxia/Reoxygenation Injury by Inhibiting an Egr-1/ROS Positive Feedback Loop in H9c2 Cells.Front Pharmacol. 2018 Jan 25;9:19. doi: 10.3389/fphar.2018.00019. eCollection 2018. Front Pharmacol. 2018. PMID: 29422863 Free PMC article.
-
Nucleolar caspase-2: Protecting us from DNA damage.J Cell Biol. 2017 Jun 5;216(6):1521-1523. doi: 10.1083/jcb.201704114. Epub 2017 May 12. J Cell Biol. 2017. PMID: 28500181 Free PMC article.
-
Remimazolam alleviates hepatic ischemia-reperfusion injury by activating FOXO1/3 signaling : Remimazolam alleviates hepatic ischemia reperfusion injury.BMC Gastroenterol. 2025 Apr 22;25(1):283. doi: 10.1186/s12876-025-03820-3. BMC Gastroenterol. 2025. PMID: 40263992 Free PMC article.
References
-
- Kumar S. Caspase function in programmed cell death. Cell Death Differ. 2007;14:32–43. - PubMed
-
- Kumar S. Caspase 2 in apoptosis, the DNA damage response and tumour suppression: enigma no more. Nat Rev Cancer. 2009;9:897–903. - PubMed
-
- Kumar S, Kinoshita M, Noda M, Copeland NG, Jenkins NA. Induction of apoptosis by the mouse Nedd2 gene, which encodes a protein similar to the product of the Caenorhabditis elegans cell death gene ced-3 and the mammalian IL-1 beta-converting enzyme. Genes Dev. 1994;8:1613–1626. - PubMed
-
- Kumar S, Tomooka Y, Noda M. Identification of a set of genes with developmentally down-regulated expression in the mouse brain. Biochem Biophys Res Commun. 1992;185:1155–1161. - PubMed
Publication types
MeSH terms
Substances
LinkOut - more resources
Full Text Sources
Medical
Molecular Biology Databases
Research Materials
Miscellaneous

