. 2012 Aug;26(8):1829-41.
doi: 10.1038/leu.2012.49. Epub 2012 Feb 20.

Depletion of RUNX1/ETO in t(8;21) AML cells leads to genome-wide changes in chromatin structure and transcription factor binding

Affiliations
Free PMC article

Depletion of RUNX1/ETO in t(8;21) AML cells leads to genome-wide changes in chromatin structure and transcription factor binding

A Ptasinska et al. Leukemia. 2012 Aug.
Free PMC article

Abstract

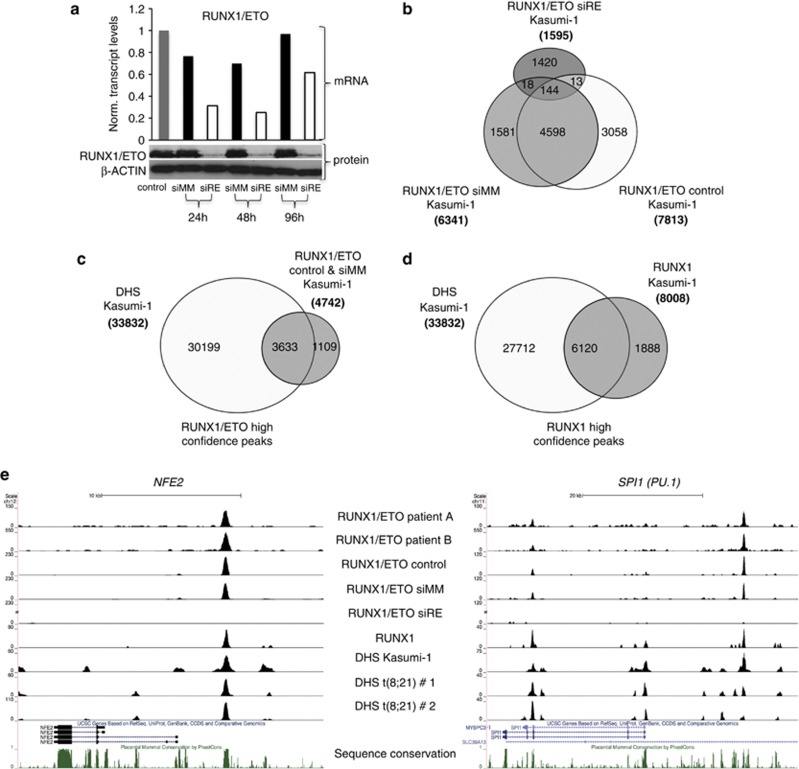
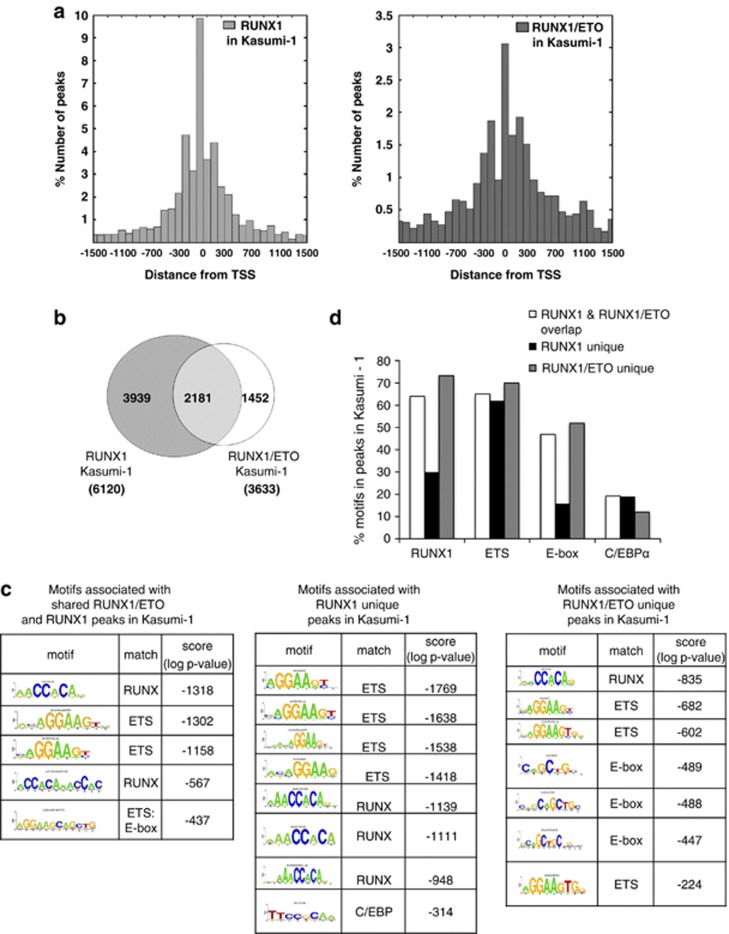
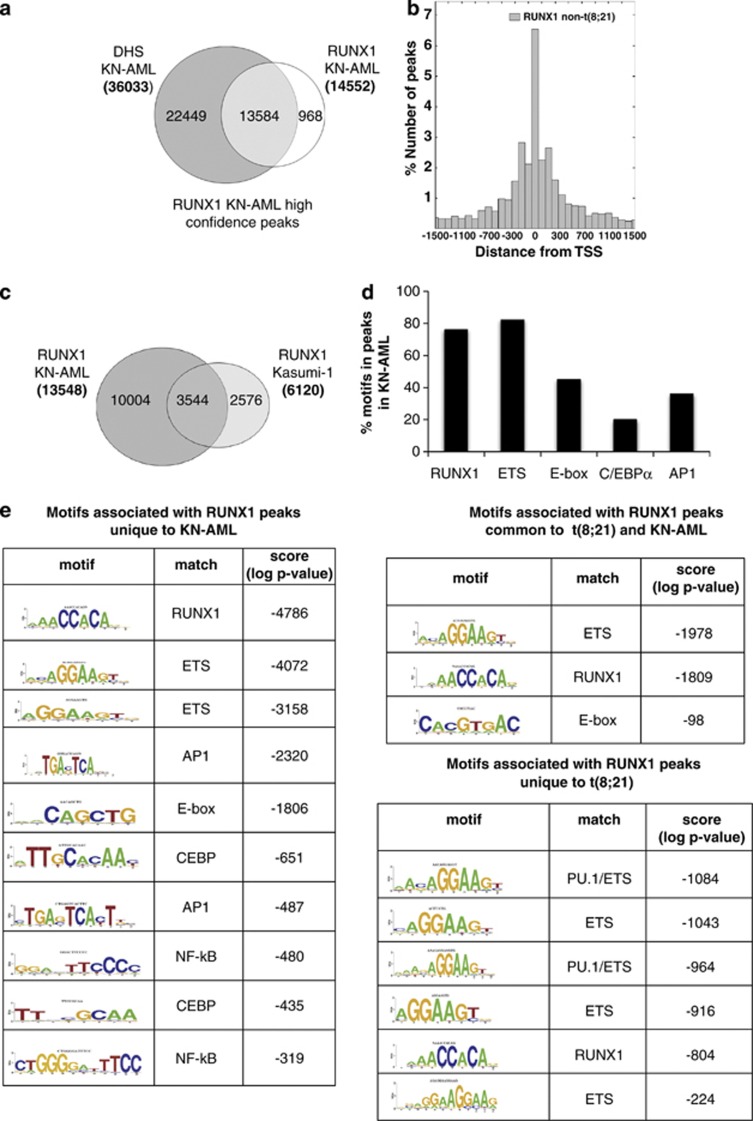
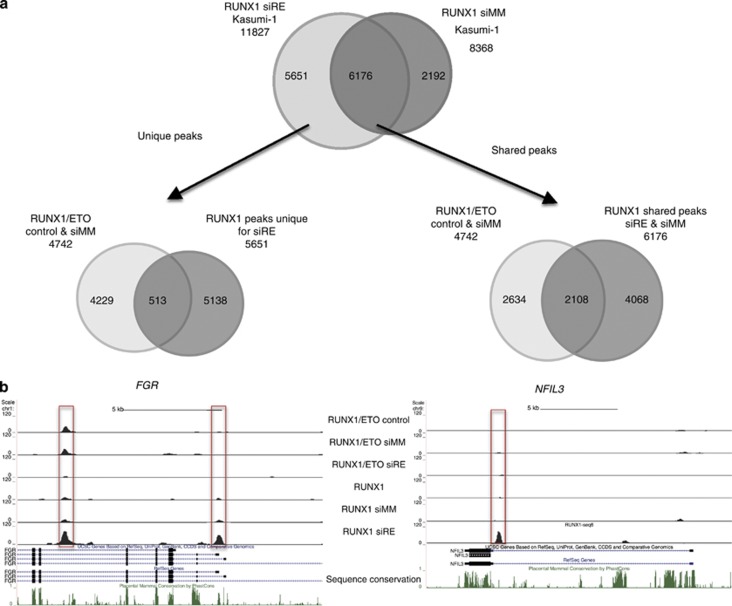
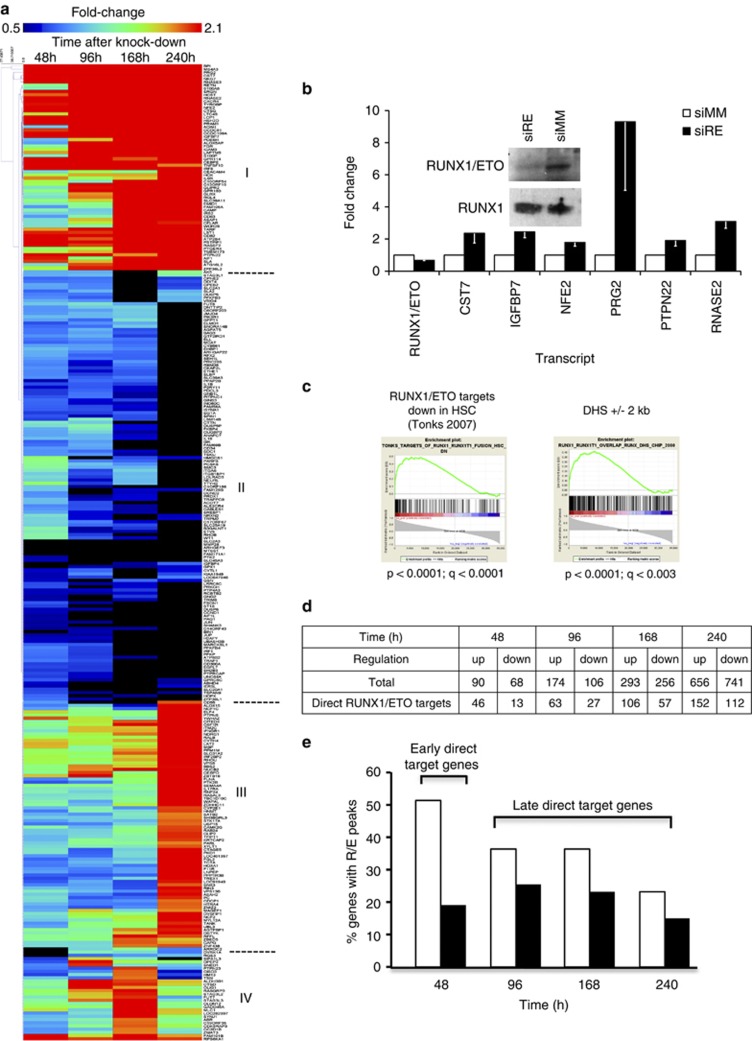
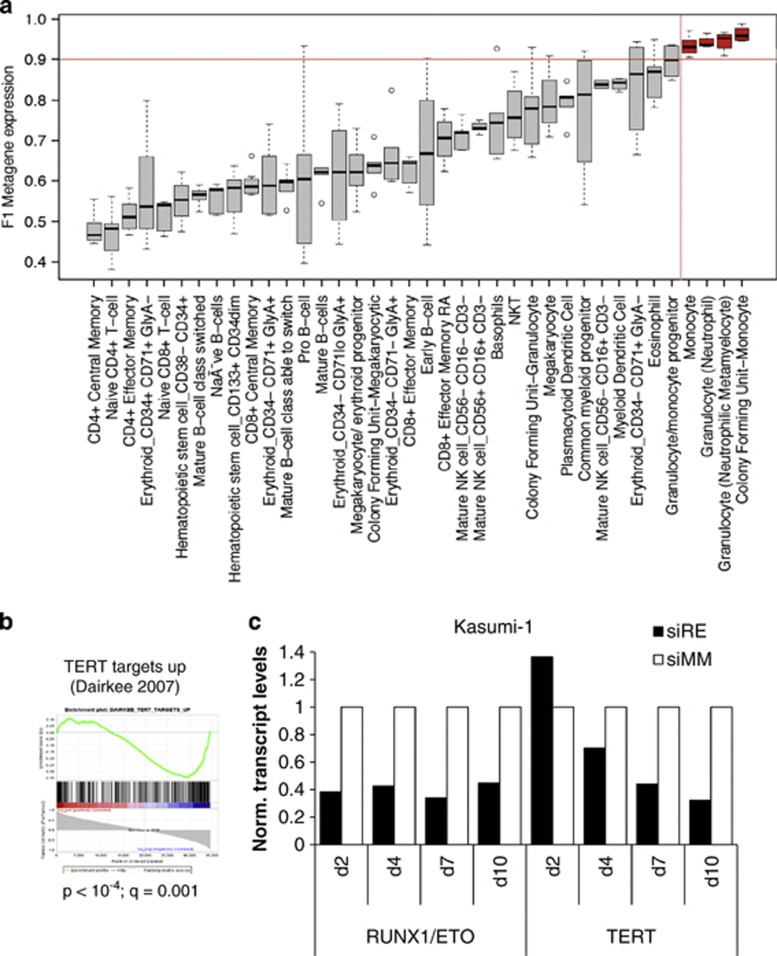
The t(8;21) translocation fuses the DNA-binding domain of the hematopoietic master regulator RUNX1 to the ETO protein. The resultant RUNX1/ETO fusion protein is a leukemia-initiating transcription factor that interferes with RUNX1 function. The result of this interference is a block in differentiation and, finally, the development of acute myeloid leukemia (AML). To obtain insights into RUNX1/ETO-dependant alterations of the epigenetic landscape, we measured genome-wide RUNX1- and RUNX1/ETO-bound regions in t(8;21) cells and assessed to what extent the effects of RUNX1/ETO on the epigenome depend on its continued expression in established leukemic cells. To this end, we determined dynamic alterations of histone acetylation, RNA Polymerase II binding and RUNX1 occupancy in the presence or absence of RUNX1/ETO using a knockdown approach. Combined global assessments of chromatin accessibility and kinetic gene expression data show that RUNX1/ETO controls the expression of important regulators of hematopoietic differentiation and self-renewal. We show that selective removal of RUNX1/ETO leads to a widespread reversal of epigenetic reprogramming and a genome-wide redistribution of RUNX1 binding, resulting in the inhibition of leukemic proliferation and self-renewal, and the induction of differentiation. This demonstrates that RUNX1/ETO represents a pivotal therapeutic target in AML.


Figures

Figure 1
Figure 1
Identification of high-confidence binding sites for RUNX1/ETO and RUNX1. (a) Time course of RUNX1/ETO knockdown in Kasumi-1 cells. Top panel: real-time PCR analysis of mRNA expression; bottom panels: immunoblot detection of RUNX1/ETO protein. β-ACTIN served as loading control. Time points are indicated at the bottom. RUNX1/ETO transcript levels are recovering 48 h after siRNA electroporation, whereas protein levels remain low for another 24 h. siRE, RUNX1/ETO siRNA; siMM, mismatch siRNA; control, mock-transfected cells. (b) Intersection analysis of RUNX1/ETO peaks. The Venn diagram shows the overlap between RUNX1/ETO peaks in mock, mismatch siRNA or RUNX1/ETO siRNA-treated Kasumi-1 cells. The vast majority of RUNX1/ETO peaks were common to mock and siMM-treated Kasumi-1 cells, and >97% of the common peaks disappeared after RUNX1/ETO depletion. (c, d) Identification of high-confidence peaks for RUNX1/ETO and RUNX1 in Kasumi-1 cells. More than 75% of both the RUNX1/ETO and RUNX1 peaks colocalize with DHS in Kasumi-1 cells, thus constituting high-confidence peaks. (e) UCSC Genome Browser image depicting the human NFE2 and SPI1 (PU.1) loci demonstrating a colocalization of RUNX1/ETO peaks in patient cells, specific RUNX1/ETO and RUNX1 peaks in Kasumi-1 cells as well as DHS.
Figure 2
Figure 2
Identification and characterization of RUNX1/ETO and RUNX1 target regions in t(8;21) cells. (a) Positional distribution of RUNX1- (left) or RUNX1/ETO- (right) binding sites relative to the transcription start site (TSS) of their nearest gene. (b) Intersection of RUNX1 and RUNX1/ETO peaks in Kasumi-1 cells. The Venn diagram shows the numbers of high-confidence peaks bound by RUNX1 and RUNX1/ETO. (c) De novo motif discovery performed on the set of regions bound by the RUNX1 and/or RUNX1/ETO in Kasumi-1 cells identified enriched RUNX consensus and different types of ETS factor-binding sites. E-box motifs were significantly enriched in peaks either unique for RUNX1/ETO or common to RUNX1/ETO and RUNX1. (d) RUNX, ETS, E-box and C/EBP consensus sequence were mapped back to all regions bound by RUNX1/ETO and RUNX1. A large proportion of regions bound by RUNX1 did not contain RUNX (TGYGGT) and/or E-box (CANNTG) consensus binding motifs, whereas most regions contain ETS (GGAW) sites.
Figure 3
Figure 3
RUNX1 in t(8;21)-positive and -negative leukemic cells associates with different binding sites motifs. (a) Identification of high-confidence RUNX1 peaks from blasts from a AML patient with a normal karyotype (KN-AML). Venn diagram showing the intersection of RUNX1 peaks with DHS. (b) Positional distribution of RUNX1-binding sites in KN-AML blasts relative to the transcription start site (TSS) of their nearest gene. (c) Intersection of RUNX1 peaks in KN-AML cells and in Kasumi-1 cells. The Venn diagram shows the numbers of high-confidence peaks bound by RUNX1. (d) RUNX1 consensus sequences were mapped back to all regions bound by RUNX1 in t(8;21)-negative AML blasts. A large proportion of regions exclusively bound by RUNX1 contain RUNX, ETS and E-box consensus binding motifs as well as consensus binding motifs for C/EBP and AP1. (e) De novo motif discovery performed on the set of regions bound by RUNX1 in t(8;21)-negative KN-AML blasts identifies enriched RUNX and ETS consensus sequences as well as E-box, AP1- and C/EBP-binding sites.
Figure 4
Figure 4
Knockdown of RUNX1/ETO leads to a redistribution of RUNX1 binding. Kasumi-1 cells were electroporated with either mismatch control siRNA (siMM) or RUNX1/ETO siRNA (siRE). Two days after siRNA electroporation, RUNX1 binding was measured by ChIP sequencing in both populations. (a) Top panel: Venn diagram showing the appearance of new RUNX1-binding sites after RUNX1/ETO depletion. Bottom left: Venn diagram showing the overlap between RUNX1/ETO-bound regions and de novo RUNX1 sites, demonstrating that the latter are distinct from sites previously bound by RUNX1/EO. Bottom right: Venn diagram showing the overlap between RUNX1/ETO-bound sequences and sites bound by RUNX1 before and after RUNX1/ETO depletion. (b) Example of alterations in RUNX1 binding. Left panel shows UCSC browser images depicting one gene (NFIL3) at a site not previously bound by RUNX1/ETO and another gene (FGR) showing a de novo RUNX1 with a RUNX1/ETO-bound site showing an increase in RUNX1 binding at this site after knockdown.
Figure 5
Figure 5
Analysis of RUNX1/ETO-dependent gene expression patterns. (a) Hierarchical clustering of genes responding by an at least twofold change in expression levels to RUNX1/ETO knockdown in Kasumi-1 cells. The heat map shows early upregulated (Group I), downregulated (Group II) and late upregulated genes (Group III) over a time course of 10 days. At the bottom of the heat map note non-clustered genes that are either upregulated more than threefold or show a more complex response pattern (Group IV). Expression levels were compared between RUNX1/ETO siRNA and mismatch siRNA-treated cells. Time points are indicated on the top of the heat map. Dark red indicates highly upregulated genes and black indicates highly downregulated genes. (b) Effect of RUNX1/ETO depletion on gene expression in primary t(8;21) AML blasts. The graph shows real-time PCR-based validation of early responding genes. The columns represent the means for three t(8;21) AML patients and the error bars the s.e.m. Inset: immunoblot showing siRNA-mediated depletion of RUNX1/ETO in blasts from a t(8;21) AML patient. (c) GSEA ranked according to the correlation of genes with a metagene (F1) summarizing the gene expression profile of Kasumi-1 cells after RUNX1/ETO knockdown. From left to right: significant enrichment of gene sets downregulated in human hematopoietic stem cells upon RUNX1/ETO overexpression and enrichment of genes determined in this study to have a high-confidence RUNX1/ETO-binding site with a corresponding DHS in the region 2 kb upstream of the start of transcription in Kasumi-1 cells. P, nominal P-value; q, false discovery rate. (d) The numbers of upregulated and downregulated genes upon RUNX1/ETO depletion in Kasumi-1 cells. The bottom row indicates genes with RUNX1/ETO peaks. (e) Classification of RUNX1/ETO target genes. The columns show the percentage of genes with high-confidence RUNX1/ETO peaks of all genes with changed gene expression upon RUNX1/ETO knockdown. siMM, mismatch siRNA; siRE, RUNX1/ETO siRNA.
Figure 6
Figure 6
RUNX1/ETO silencing leads to changes in RNA-Polymerase II occupancy and the histone H3K9 acetylation pattern at RUNX1/ETO target genes. (a) Comparison of RNA Pol II occupation with transcriptional profiling reveals a substantial correlation between changes in gene expression and changes in RNA Pol II association upon RUNX1/ETO knockdown. RNA Pol II occupation was analyzed 48 h after siRNA treatment, ranked according to fold change in occupancy and compared with changes in gene expression during a time course of 10 days with siRNA treatment. Dark red indicates high occupancy or upregulation, black low occupancy or downregulation, respectively. (b) The H3K9Ac pattern correlates partially with changes in gene expression associated with RUNX1/ETO depletion. H3K9Ac occupation was analyzed and compared analogously to (a). (c, d) UCSC Genome Browser image of the human ZBTB16 and WT1 loci depicting ChIP-Seq tags for RUNX1/ETO, RNA-Pol II and H3K9Ac in mock-treated (control), mismatch siRNA (siMM) and RUNX1/ETO siRNA (siRE)-treated Kasumi-1 cells. (e) Heat map resulting from an unsupervised clustering of H3K9Ac- and RUNX1/ETO-binding sites with and without RUNX1/ETO knockdown (siMM and siRE, respectively) as well as without transfection (control) showing two groups of sequences and their genomic location. In each lane, the ChIP enrichment score is shown 10 kb upstream and downstream from the peak center. (f) Integration of the sequence enrichment of each group into a density plot showing the location of RUNX1/ETO-binding sites with and without knockdown in relation to H3K9Ac. Dark blue: H3K9Ac (siMM); pink: H3K9Ac (siRE); green: RUNX1/ETO (control); yellow RUNX1/ETO (siMM); light blue: RUNX1/ETO (siRE).
Figure 6
Figure 6
RUNX1/ETO silencing leads to changes in RNA-Polymerase II occupancy and the histone H3K9 acetylation pattern at RUNX1/ETO target genes. (a) Comparison of RNA Pol II occupation with transcriptional profiling reveals a substantial correlation between changes in gene expression and changes in RNA Pol II association upon RUNX1/ETO knockdown. RNA Pol II occupation was analyzed 48 h after siRNA treatment, ranked according to fold change in occupancy and compared with changes in gene expression during a time course of 10 days with siRNA treatment. Dark red indicates high occupancy or upregulation, black low occupancy or downregulation, respectively. (b) The H3K9Ac pattern correlates partially with changes in gene expression associated with RUNX1/ETO depletion. H3K9Ac occupation was analyzed and compared analogously to (a). (c, d) UCSC Genome Browser image of the human ZBTB16 and WT1 loci depicting ChIP-Seq tags for RUNX1/ETO, RNA-Pol II and H3K9Ac in mock-treated (control), mismatch siRNA (siMM) and RUNX1/ETO siRNA (siRE)-treated Kasumi-1 cells. (e) Heat map resulting from an unsupervised clustering of H3K9Ac- and RUNX1/ETO-binding sites with and without RUNX1/ETO knockdown (siMM and siRE, respectively) as well as without transfection (control) showing two groups of sequences and their genomic location. In each lane, the ChIP enrichment score is shown 10 kb upstream and downstream from the peak center. (f) Integration of the sequence enrichment of each group into a density plot showing the location of RUNX1/ETO-binding sites with and without knockdown in relation to H3K9Ac. Dark blue: H3K9Ac (siMM); pink: H3K9Ac (siRE); green: RUNX1/ETO (control); yellow RUNX1/ETO (siMM); light blue: RUNX1/ETO (siRE).
Figure 7
Figure 7
RUNX1/ETO knockdown interferes with leukemic self-renewal and promotes myeloid differentiation. (a) Comparison of F1 metagene expression in normal hematopoietic sub-populations reveals high similarity between gene expression patterns of RUNX1/ETO-depleted Kasumi-1 cells and those of monocytic and granulocytic cell types. The values of the F1 metagene for siMM-treated and siRE-treated Kasumi-1 cells are close to 0 and 1, respectively. Those colored red are cell types for which expression of the metagene is at least equal to RUNX1/ETO-depleted Kasumi-1 cells indicating maximum similarity. (b) Gene set enrichment analysis using a ranking of TERT targets and their correlation with the F1 metagene showing an inverse correlation of expression after knockdown. P, nominal P-value; q, false discovery rate. (c) RUNX1/ETO depletion inhibits TERT expression. t(8;21)-positive Kasumi-1 were electroporated with either RUNX1/ETO or mismatch siRNA (siRE and siMM, respectively) at day 2, 4, 7 and 10. RUNX1/ETO and TERT transcript levels were analyzed at the indicated time points by real-time PCR. The color reproduction of this figure is available at the Leukemia journal online.

Similar articles

Cited by

References

    1. Bonifer C, Bowen DT. Epigenetic mechanisms regulating normal and malignant haematopoiesis: new therapeutic targets for clinical medicine. Expert Rev Mol Med. 2010;12:e6. - PubMed
    1. Wang Q, Stacy T, Miller JD, Lewis AF, Gu TL, Huang X, et al. The CBFbeta subunit is essential for CBFalpha2 (AML1) function in vivo. Cell. 1996;87:697–708. - PubMed
    1. Okuda T, van Deursen J, Hiebert SW, Grosveld G, Downing JR. AML1, the target of multiple chromosomal translocations in human leukemia, is essential for normal fetal liver hematopoiesis. Cell. 1996;84:321–330. - PubMed
    1. Erickson P, Gao J, Chang KS, Look T, Whisenant E, Raimondi S, et al. Identification of breakpoints in t(8;21) acute myelogenous leukemia and isolation of a fusion transcript, AML1/ETO, with similarity to Drosophila segmentation gene, runt. Blood. 1992;80:1825–1831. - PubMed
    1. Miyoshi H, Kozu T, Shimizu K, Enomoto K, Maseki N, Kaneko Y, et al. The t(8;21) translocation in acute myeloid leukemia results in production of an AML1-MTG8 fusion transcript. EMBO J. 1993;12:2715–2721. - PMC - PubMed

Publication types

MeSH terms