. 2012 Jul;20(7):1519-26.
doi: 10.1038/oby.2012.22. Epub 2012 Feb 20.

Anatomical and functional assessment of brown adipose tissue by magnetic resonance imaging

Affiliations

Anatomical and functional assessment of brown adipose tissue by magnetic resonance imaging

Y Iris Chen et al. Obesity (Silver Spring). 2012 Jul.

Abstract

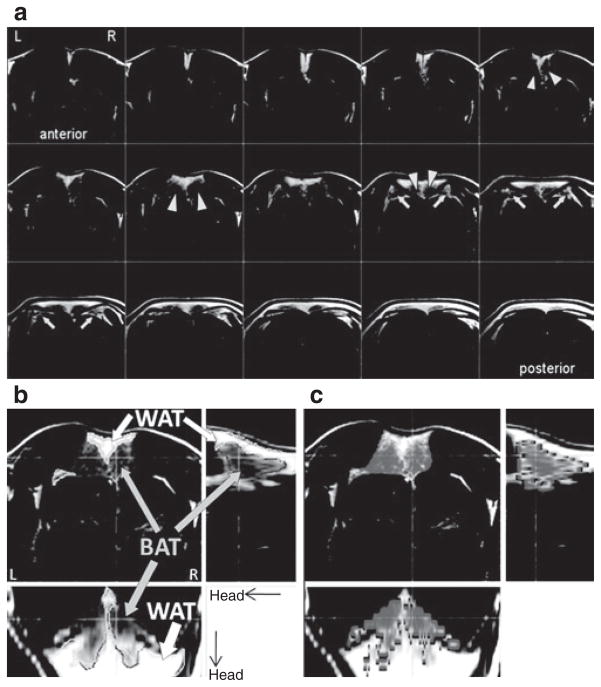
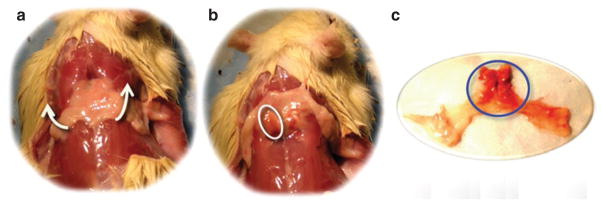
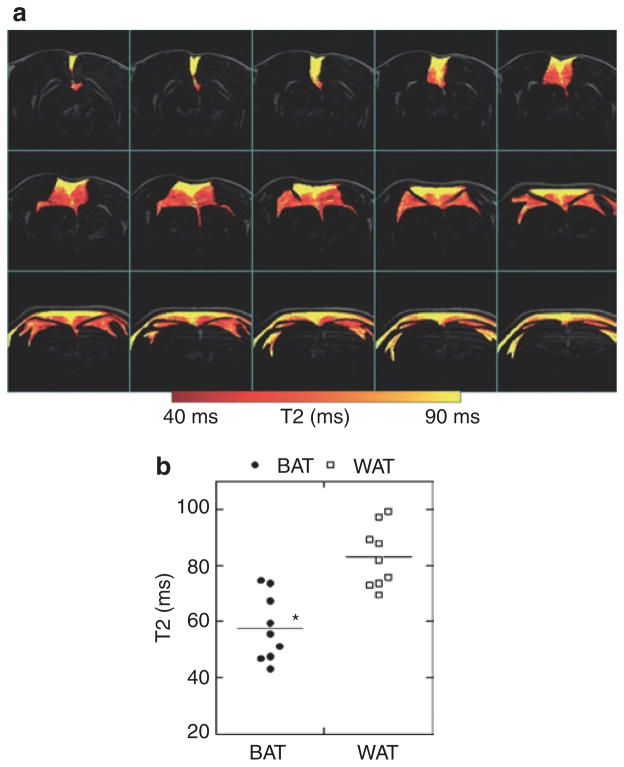
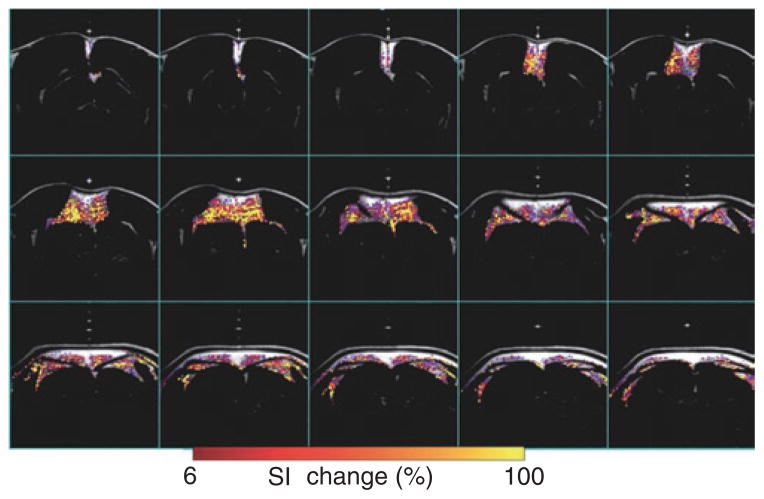
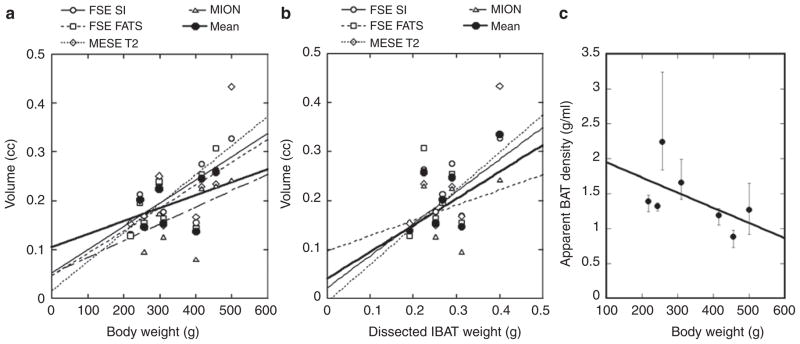
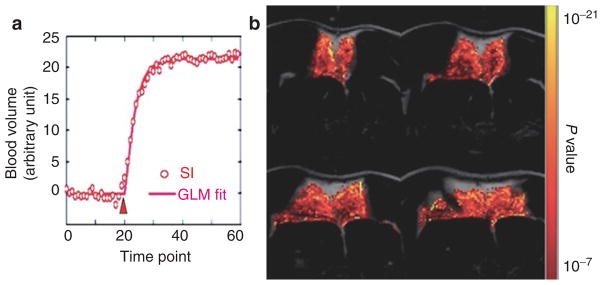
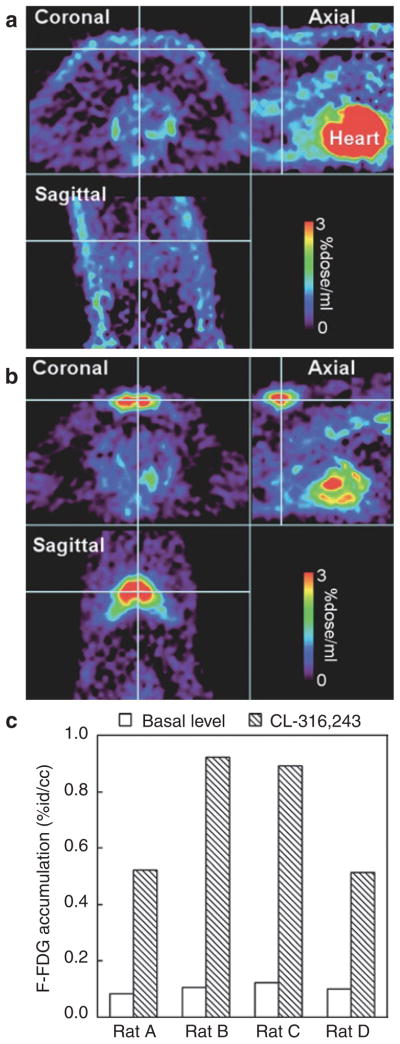
Brown adipose tissue (BAT) is the primary tissue responsible for nonshivering thermogenesis in mammals. The amount of BAT and its level of activation help regulate the utilization of excessive calories for thermogenesis as opposed to storage in white adipose tissue (WAT) which would lead to weight gain. Over the past several years, BAT activity in vivo has been primarily assessed by positron emission tomography-computed tomography (PET-CT) scan using 2-[18F]-fluoro-2-deoxy-D-glucose (18F-FDG) to measure glucose utilization associated with BAT mitochondrial respiration. In this study, we demonstrate the feasibility of mapping and estimating BAT volume and metabolic function in vivo in rats at a 9.4T magnetic resonance imaging (MRI) scanner using sequences available from clinical MR scanners. Based on the morphological characteristics of BAT, we measured the volume distribution of BAT with MRI sequences that have strong fat-water contrast. We also investigated BAT volume by utilizing spin-echo MRI sequences. The in vivo MRI-estimated BAT volumes were correlated with direct measurement of BAT mass from dissected samples. Using MRI, we also were able to map hemodynamic responses to changes in BAT metabolism induced pharmacologically by β3-adrenergic receptor agonist, CL-316,243 and compare this to BAT activity in response to CL-316,243 assessed by PET 18F-FDG. In conclusion, we demonstrate the feasibility of measuring BAT volume and function in vivo using routine MRI sequences. The MRI measurement of BAT volume is consistent with quantitative measurement of the tissue ex vivo.


Conflict of interest statement

DISCLOSURE

The authors declared no conflict of interest.

Figures

Figure 1
Figure 1
Use of FSE to distinguish BAT from WAT. (a) Fast-spin echo (FSE) shows great signal contrast between WAT and BAT, with hyperintensity in WAT and hypointensity in BAT. FSE images identified two primary BAT lumps (arrow heads) in the interscapular area, immediately beneath a sheet of WAT. FSE images also identified to side BAT wings (arrows). Note that FSE with the chosen echo time is insensitive to muscle signal. (b) Example of WAT and BAT segmentation, according to threshold in signal intensity (BAT and WAT are indicated by solid boundaries). Showing in the figure is a representative result of a single rat, from a pool of nine animals. (c) Fat saturation routine is less efficient for BAT, due to the higher water content. Thus, BAT volume (areas in gray tone) can be segmented according to fat saturation efficiency (online version of article indicates degree of fat saturation in color scale). The underlay is a non-FATS FSE image. BAT, brown adipose tissue; FATS, no fat saturation; WAT, white adipose tissue.
Figure 2
Figure 2
Two primary IBAT masses are located underneath the triangular WAT sheet. (a) Triangle WAT sheet in the interscapular area. (b) IBAT (circled) can be seen by flipping the WAT sheet upward. (c) Fat tissue dissection showed WAT (yellow tissue) and BAT (brown tissue, circled). BAT, brown adipose tissue; IBAT, interscapular BAT; WAT, white adipose tissue.
Figure 3
Figure 3
Separate BAT and WAT via T2 evaluation. BAT has short T2 value, due to the heterogeneous tissue contents with higher iron/mitochondrial level and greater vascular population. (a) Map of T2 values of fat, with higher T2 values in WAT and lower T2 values in BAT. (b) Distribution of T2 values for BAT and WAT from all animals. BAT: 57.76 ± 3.92 (ms), WAT: 83.07 ± 2.20. Paired Student’s t-test: P < 10−6. BAT, brown adipose tissue; WAT, white adipose tissue.
Figure 4
Figure 4
Map of blood perfusion over BAT. BAT has significant higher blood perfusion, due to the high vessel distribution. Blood perfusion map was generated by contrasting MR signal intensity before and after MION injection. Color overlay shows fat tissue with high blood perfusion (>6% changes in signal intensity after MION injection), primarily in BAT area. BAT, brown adipose tissue; MION, monocrystalline iron oxide nanocolloid; MR, magnetic resonance; SI, signal intensity.
Figure 5
Figure 5
Correlate MR measurement of BAT to body weight and tissue dissection. (a) Correlation between MRI-estimated volume vs. body weight (FSE SI: R > 0.74, FSE fat supp. and MESE T2: R > 0.65, MION: R > 0.5). (b) Correlation between MRI-estimated volume vs. weight of IBAT tissue (FSE SI: R > 0.65, MESE T2: R > 0.79). The conversion of IBAT weight to volume was not exact, as we assumed uniform density of IBAT. The poor correlation between the MION results and IBAT weight may be due to the indirect measurement of blood perfusion by MION, and the relative uncertain factor between IBAT weight and mass. (c) Apparent density of BAT is inversely correlated to body weight. Error bar represents the range of apparent density measurement from the four MRI methods. BAT, brown adipose tissue; FATS, fat saturation; FSE, fast-spin echo; IBAT, interscapular BAT; MESE, multi-echo spin-echo sequence; MION, monocrystalline iron oxide nanocolloid; MRI, magnetic resonance imaging; SI, signal intensity.
Figure 6
Figure 6
Use fMRI to map IBAT response to a β3-adrenergic receptor agonist, CL-316,243 (0.1 mg/ml, intravenously). (a) Time course for blood volume changes in IBAT. CL-316,243 was injected at the 20th time point (“Δ” ) and led to blood volume increases. (b) The activation map was generated by fitting time courses to a basis function (solid line in a) describing the hemodynamic changes on a pixel-by-pixel basis. BAT, brown adipose tissue; fMRI, functional magnetic resonance imaging; GLM, general linear model; IBAT, interscapular BAT; SI, signal intensity.
Figure 7
Figure 7
18F-FDG study for BAT activity. (a) At basal level, 18F-FDG accumulation was high in the heart. But there was no significant accumulation in BAT (cross hair). (b) After CL-316,243 challenge (0.1 mg/kg, intravenously), there was a significant 18F-FDG accumulation in BAT (cross hair). The 18F-FDG accumulation in the heart was greatly reduced from the basal level. (c) Quantitative comparison of 18F-FDG accumulation in IBAT at basal level and after CL-316,243 challenge. The color bar presents percent of the injected isotope dose per ml. 18F-FDG, 2-[18F]-fluoro-2-deoxy-D-glucose; BAT, brown adipose tissue; IBAT, interscapular BAT.

Similar articles

Cited by

References

    1. Kozak LP, Koza RA, Anunciado-Koza R. Brown fat thermogenesis and body weight regulation in mice: relevance to humans. Int J Obes (Lond) 2010;34(Suppl 1):S23–S27. - PubMed
    1. Ravussin E, Kozak LP. Have we entered the brown adipose tissue renaissance? Obes Rev. 2009;10:265–268. - PMC - PubMed
    1. Galic S, Oakhill JS, Steinberg GR. Adipose tissue as an endocrine organ. Mol Cell Endocrinol. 2010;316:129–139. - PubMed
    1. Cinti S. The adipose organ. Prostaglandins Leukot Essent Fatty Acids. 2005;73:9–15. - PubMed
    1. Nedergaard J, Golozoubova V, Matthias A, et al. UCP1: the only protein able to mediate adaptive non-shivering thermogenesis and metabolic inefficiency. Biochim Biophys Acta. 2001;1504:82–106. - PubMed

Publication types

Substances