. 2012 Apr 4;31(7):1644-53.
doi: 10.1038/emboj.2012.35. Epub 2012 Feb 17.

Human mitotic chromosomes consist predominantly of irregularly folded nucleosome fibres without a 30-nm chromatin structure

Affiliations

Human mitotic chromosomes consist predominantly of irregularly folded nucleosome fibres without a 30-nm chromatin structure

Yoshinori Nishino et al. EMBO J. .

Abstract

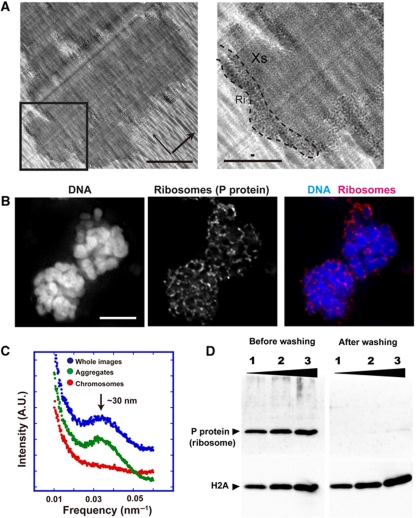
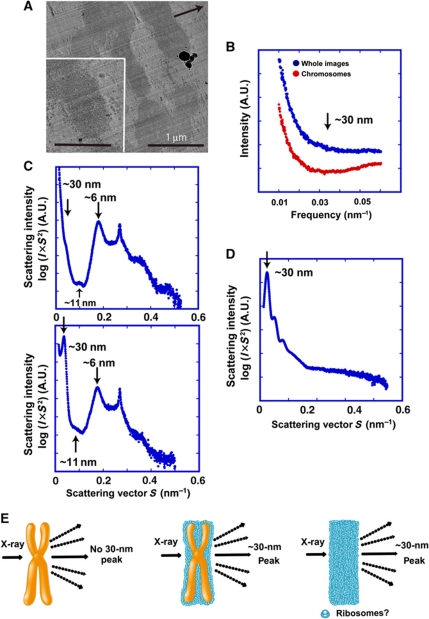
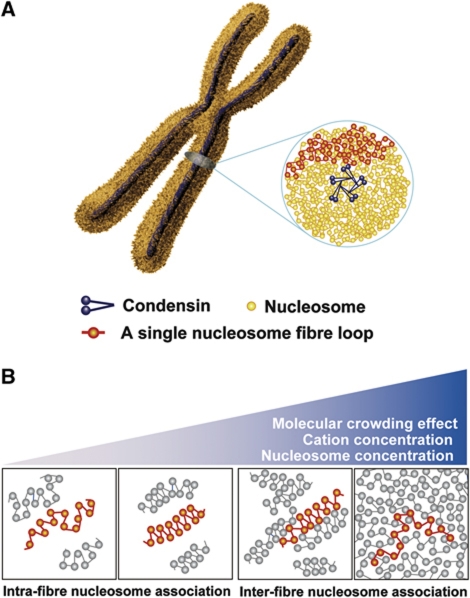
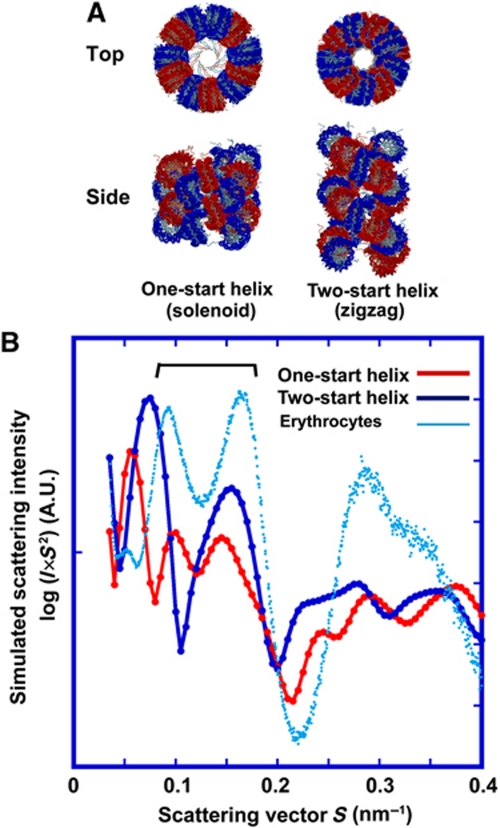
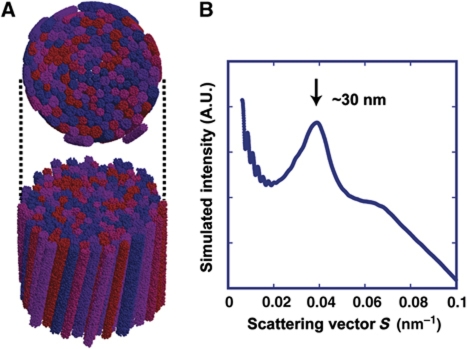
How a long strand of genomic DNA is compacted into a mitotic chromosome remains one of the basic questions in biology. The nucleosome fibre, in which DNA is wrapped around core histones, has long been assumed to be folded into a 30-nm chromatin fibre and further hierarchical regular structures to form mitotic chromosomes, although the actual existence of these regular structures is controversial. Here, we show that human mitotic HeLa chromosomes are mainly composed of irregularly folded nucleosome fibres rather than 30-nm chromatin fibres. Our comprehensive and quantitative study using cryo-electron microscopy and synchrotron X-ray scattering resolved the long-standing contradictions regarding the existence of 30-nm chromatin structures and detected no regular structure >11 nm. Our finding suggests that the mitotic chromosome consists of irregularly arranged nucleosome fibres, with a fractal nature, which permits a more dynamic and flexible genome organization than would be allowed by static regular structures.


Conflict of interest statement

The authors declare that they have no conflict of interest.

Figures

Figure 1
Figure 1
SAXS profile of mitotic HeLa chromosomes. (A) A typical SAXS pattern of the chicken erythrocyte nuclei using the BL45XU beamline at SPring-8. In the plot of log(I × S2) versus S, I is the measured average intensity and S is the size of the scattering vector, the inverse of the structure or spacing size (for details, see Materials and methods). Note that as size variations may exist in the structures, peaks in the measurements may also exhibit some variation. The chicken erythrocyte nuclei produced a sharp 30-nm peak (arrow). In addition, two peaks of ∼11 and ∼6 nm were prominent (brackets). (B) Dot-like 30-nm structures in the chicken erythrocyte nucleus were observed by cryo-EM (see also Supplementary Figure S1). Bar indicates 5 μm. (C) High-resolution cryo-EM image of a chicken erythrocyte nucleus. Long and short bars indicate 200 and 30 nm, respectively. (D) Two types of nucleosome positioning: face-to-face, with ∼6-nm spacing, and edge-to-edge, with ∼11-nm spacing. Note that in helical fibres such as the 30-nm chromatin fibre, edge-to-edge spacing likely corresponds to helical pitch (Figure 6A). The nucleosome model was taken from Davey et al (2002) (yellow, DNA; red, core histones). (E, F) Typical SAXS patterns of mitotic HeLa chromosomes. In (E), a SAXS scattering pattern covering larger angles is shown to reveal smaller structures. Three peaks at ∼6, ∼11 and ∼30 nm were detected (arrows) (see also Supplementary Figure S2A and B).
Figure 2
Figure 2
Ribosome aggregates around chromosomes. (A) Cryo-EM image of the chromosome clusters (cross-sections). Many black dots were observed on the chromosome surface. Note that knife marks (thick arrow) and compression marks (thin arrow) were observed. Bars indicate 1 μm. An enlarged image of the region outlined with a box is depicted on the right. A black dot region is surrounded by a broken line (Ri). A chromosome part is marked as ‘Xs’. Long and short bars indicate 0.5 μm and 30 nm, respectively. (B) Immunostaining with anti-P antibody against a ribosomal component suggested that the peripheral black dots were ribosome aggregates (Uchiumi et al, 1990). DNA (DAPI), a ribosome and merged images of two chromosome clusters are shown. Bar indicates 10 μm (see also (D) and Supplementary Figure S3). (C) Power spectrum (Fourier transform) analyses of the aggregated regions, the chromosome regions and whole cryo-EM images. A 30-nm peak (arrow) was seen in the aggregated region (green dots) and whole images (blue dots). (D) Ribosome removal was verified by western blotting (Uchiumi et al, 1990).
Figure 3
Figure 3
The 30-nm peak on the SAXS profile was derived from ribosome aggregates. (A) Removal of ribosome aggregates. Isolated chromosomes were washed in buffer A (polyamine + EDTA) (Lewis and Laemmli, 1982; Paulson and Langmore, 1983; Maeshima and Laemmli, 2003) and then returned to IB containing 5 mM Mg2+ (Paulson and Langmore, 1983). Cryo-EM showed that this treatment removed most of the aggregates. Note that knife marks (arrow) were observed. Bar indicates 1 μm. The inset shows an enlarged image. Long and short bars indicate 0.5 μm and 30 nm, respectively. (B) Power spectrum (Fourier transform) analysis of cryo-EM images after removal of ribosome aggregates. Neither whole images (blue dots) nor chromosome regions (red dots) showed a peak at ∼30 nm (arrow). (C) In SAXS analysis, only the 30-nm peak disappeared after removal of ribosome aggregates (upper), whereas the other peaks remained. For comparison, Figure 1E is reproduced (lower). (D) A ribosomal fraction from Xenopus egg extracts (kindly provided by Dr T Hirano, RIKEN) produced a 30-nm peak (arrow) on SAXS. (E) Model explaining the results: the 30-nm peak in SAXS comes from regularly spaced aggregates of ribosomes, and not from the chromosomes themselves.
Figure 4
Figure 4
Mitotic chromosomes lack notable higher-order structures. (A) Experimental setup of USAXS using the BL29XUL beamline at SPring-8 (for details, see Materials and methods). This system accomplished efficient USAXS measurements using a compact apparatus. (B) USAXS study of latex particles with diameters of ∼1000 nm showed clear fringes over a wide range (∼50–1000 nm). The profile is plotted as log(I) versus log(S). (C) A computer simulation of latex particles with diameters of ∼1000 nm produced a pattern highly similar to that measured. (D) By USAXS, no notable structures around 100–150 or 200–250 nm were detected (see also Supplementary Figure S5A). (E) The scattering intensity obeyed the power law with respect to structure size and spacing. To determine the nature of the structure at sizes over 11 nm, the logarithm of the scattering intensity (I) and size of the scattering vector (S) were taken from the data in (D) (Schmidt, 1989). A plot of log (I) versus log (S) on a straight line (red line) covered a wide range, extending over nearly four orders of magnitude. Least-squares fitting showed that I is proportional to S to the power of −3.12 (R=0.990) (Schmidt, 1989), suggesting that chromosomes do not possess notable regular structures over a very wide scale and exhibit a fractal nature of genome organization (see also Supplementary Figure S5B).
Figure 5
Figure 5
Chromosome structure model. (A) Chromosomes consist essentially of irregularly folded nucleosome (beads on a string) fibres. Condensins (blue) hold the nucleosome fibres (red) globally around the chromosome centre. Locally, the nucleosome fibre is folded in an irregular or disordered manner, forming loop structures that are collapsed towards the chromosome centre (blue). The collapsed fibre (red) forms a domain that could be compatible with the large module observed by the Belmont group (Strukov et al, 2003). (B) Dynamic melted nucleosome. Under dilute conditions with low nucleosome fibre and cation concentrations, nucleosome fibres can form 30-nm chromatin fibres via intra-fibre nucleosome associations. An increase in fibre concentration, as a consequence of an increase in cation concentration and/or a molecular crowding effect, results in inter-fibre nucleosomal contacts that interfere with intra-fibre nucleosomal associations. Nucleosomes of adjacent fibres interdigitate, leading to a polymer melt-like structure. Note that in these illustrations, we show a highly simplified two-dimensional nucleosome model, which does not show the details of chromatin fractal organization.
Figure 6
Figure 6
Computer simulation of two 30-nm chromatin fibre models. (A) Two well-known structural models of 30-nm chromatin fibres: the one-start helix (solenoid, left) and two-start helix (zigzag ribbon, right). Their atomic coordinate models (kindly provided by Dr D Rhodes, LMB, UK) are shown (Schalch et al, 2005; Robinson and Rhodes, 2006). The drawings were generated using MOLSCRIPT (Kraulis, 1991). (B) Based on the atomic model, the scattering profiles obtained with the one-start helix (red line) and two-start helix (blue line) were computationally simulated (for details, see Materials and methods). As the scattering was obtained from a single 30-nm chromatin fibre model shown in (A), the 30-nm peak was not shown. Two peaks of ∼11 and ∼6 nm were prominent (brackets) in the two-start model (blue line) and the chicken erythrocyte nuclei (cyan line). Note that the simulated scattering profile of the two-start helix (blue line) seemed to be qualitatively similar to that of chicken erythrocyte nuclei (cyan line).
Figure 7
Figure 7
Computer simulation of ‘loose’ 30-nm fibre bundles with size and torsional variations. (A) Compact bundles of 30-nm fibres, with variations in their diameter (±15%) and torsion (±15%), were computationally modelled (for details, see Materials and methods). The upper image is the top view, and the bottom is the side view. (B) The modelled 30-nm fibre bundles produced a peak at ∼30 nm (for details, see Materials and methods).

Comment in

References

    1. Alberts B, Johnson A, Lewis J, Raff M, Roberts K, Walter P (2007) Molecular Biology of the Cell, Fifth Edition. New York: Garland Science
    1. Bancaud A, Huet S, Daigle N, Mozziconacci J, Beaudouin J, Ellenberg J (2009) Molecular crowding affects diffusion and binding of nuclear proteins in heterochromatin and reveals the fractal organization of chromatin. EMBO J 28: 3785–3798 - PMC - PubMed
    1. Bordas J, Perez-Grau L, Koch MH, Vega MC, Nave C (1986) The superstructure of chromatin and its condensation mechanism. II. Theoretical analysis of the X-ray scattering patterns and model calculations. Eur Biophys J 13: 175–185 - PubMed
    1. Conway JF, Steven AC (1999) Methods for reconstructing density maps of ‘single’ particles from cryoelectron micrographs to subnanometer resolution. J Struct Biol 128: 106–118 - PubMed
    1. Davey CA, Sargent DF, Luger K, Maeder AW, Richmond TJ (2002) Solvent mediated interactions in the structure of the nucleosome core particle at 1.9Å resolution. J Mol Biol 319: 1097–1113 - PubMed

Publication types