. 2012 Feb 19;14(3):239-48.
doi: 10.1038/ncb2427.

Phosphoinositide-mediated clathrin adaptor progression at the trans-Golgi network

Affiliations

Phosphoinositide-mediated clathrin adaptor progression at the trans-Golgi network

Lydia Daboussi et al. Nat Cell Biol. .

Abstract

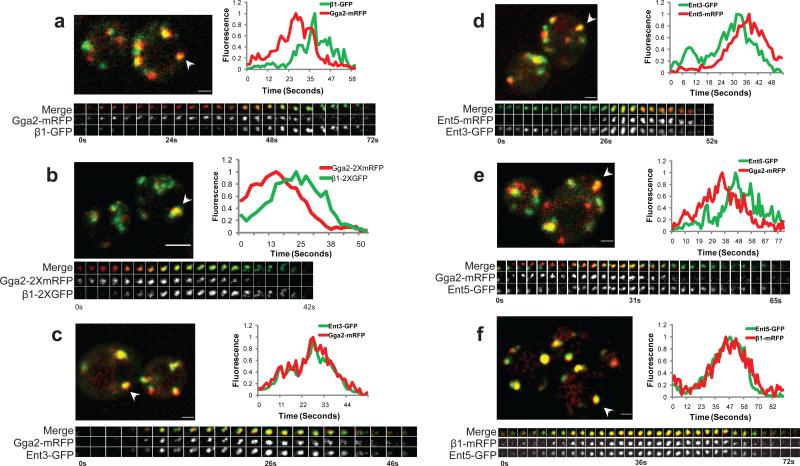
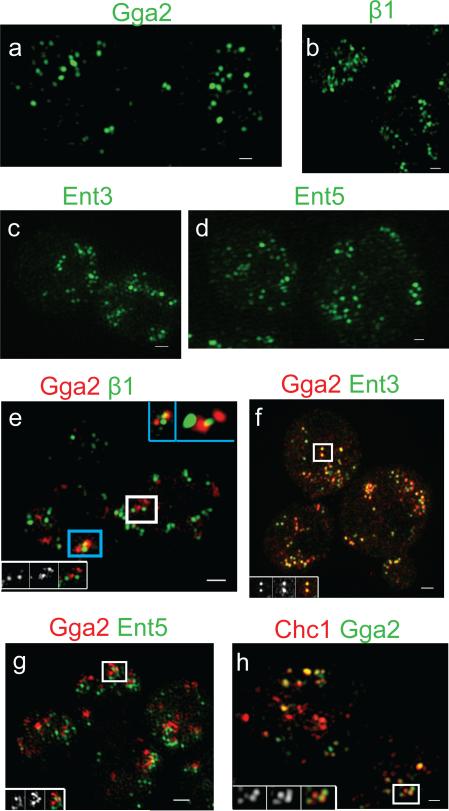
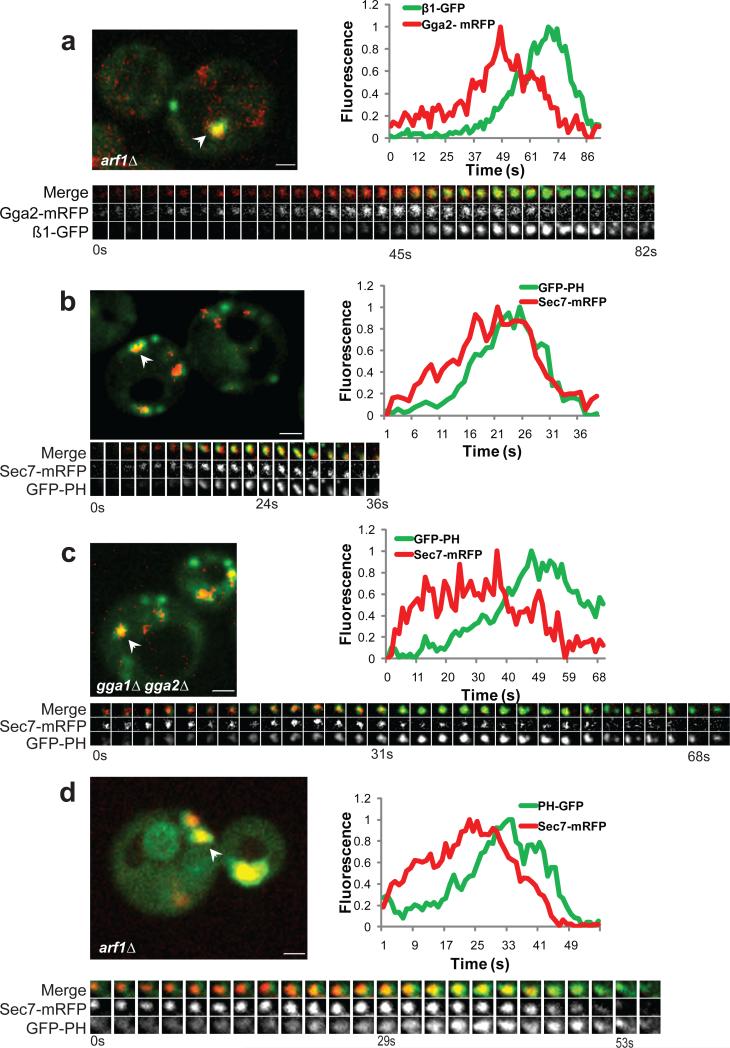
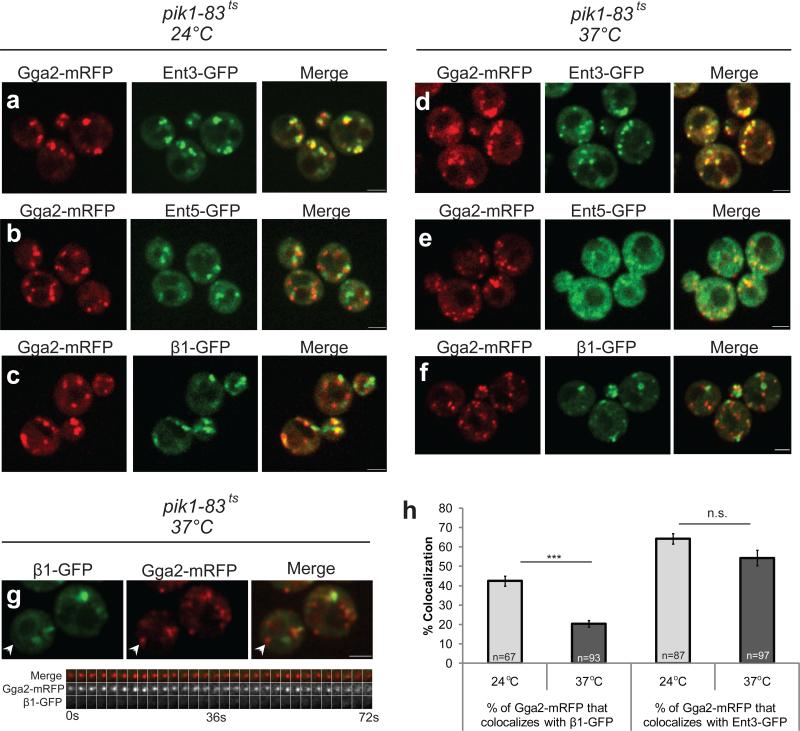
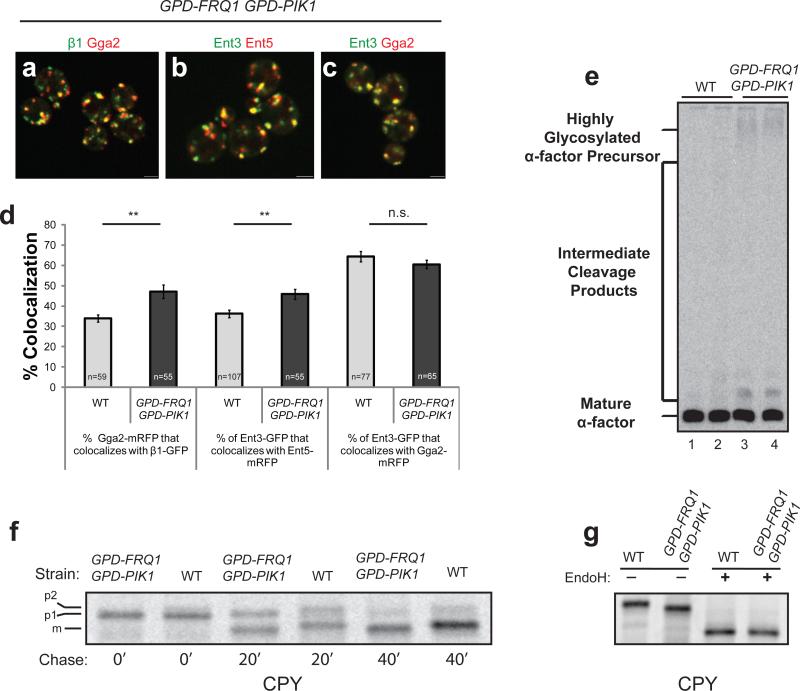
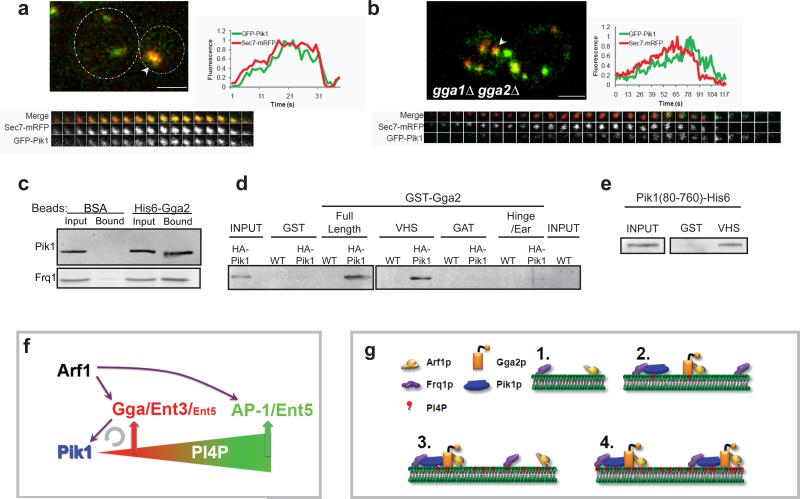
Clathrin-coated vesicles mediate endocytosis and transport between the trans-Golgi network (TGN) and endosomes in eukaryotic cells. Clathrin adaptors play central roles in coat assembly, interacting with clathrin, cargo and membranes. Two main types of clathrin adaptor act in TGN-endosome traffic: GGA proteins and the AP-1 complex. Here we characterize the relationship between GGA proteins, AP-1 and other TGN clathrin adaptors using live-cell and super-resolution microscopy in yeast. We present evidence that GGA proteins and AP-1 are recruited sequentially in two waves of coat assembly at the TGN. Mutations that decrease phosphatidylinositol 4-phosphate (PtdIns(4)P) levels at the TGN slow or uncouple AP-1 coat assembly from GGA coat assembly. Conversely, enhanced PtdIns(4)P synthesis shortens the time between adaptor waves. Gga2p binds directly to the TGN PtdIns(4)-kinase Pik1p and contributes to Pik1p recruitment. These results identify a PtdIns(4)P-based mechanism for regulating progressive assembly of adaptor-specific clathrin coats at the TGN.


Figures

Figure 1
Figure 1. Sequential assembly of clathrin adaptors
Pairs of clathrin coat proteins were assessed in two-color movies of single optical sections (a, c-f) or in 3 dimensions (b) by tracking puncta that remained separate from other puncta throughout their lifetimes and were present for at least 7 frames (~8.4 s). (a, c-f) Upper panel: merged image of live cells co-expressing GFP- and mRFP-tagged versions of the indicated clathrin adaptors; arrowhead indicates a puncta selected for kymograph in the bottom panel. Scale bar = 1 μm. (b) Upper panel: Five optical sections along the Z axis were imaged at 0.3 μm intervals. Each z-stack was collected every 2.1s. Scale bar = 2μm. (a-f) Bottom panel: three channel kymograph (merged, mRFP and GFP) of the selected puncta; time to acquire one image pair was 1.2s. Every other image pair is shown in the kymograph. (a-f) Graph: normalized level of GFP and mRFP fluorescence intensity in the puncta as a function of time. (a) GPY3109 (b) GPY4974 (c) GPY3954 (d) GPY3912 (e) GPY3962 (f) GPY3900.
Figure 2
Figure 2. Spatial relationships of clathrin adaptors by structured illumination microscopy
Cells expressing the GFP- and mRFP-tagged adaptors were imaged by structured illumination microscopy. (a-d) Maximum image projection of the GFP channel is shown for the following strains: (a) GGA2-GFP CHC1-mRFP (GPY4931), (b) β1-GFP CHC1-mRFP (GPY4932), (c) ENT3-GFP ENT5-mRFP (GPY3912), (d) ENT5-GFP β1-mRFP (GPY3900). (e-h) Maximum image projection of the merged channel is shown for (e) GGA2-mRFP β1-GFP (GPY3109). The blue box inset (top right) denotes the 3D volume view of the blue boxed region with no rotation (left) and with rotation around the x- and z-axis (right). (f) GGA2-mRFP ENT3-GFP (GPY3954), (g) GGA2-2XmRFP ENT5-2XGFP (GPY4962), (h) CHC1-mRFP GGA2-GFP (GPY4931). For e-h, insets contain (left to right) the GFP, mRFP and merged maximum image projection for the puncta in the white box. Scale bar = 400 nm.
Figure 3
Figure 3. Adaptor and clathrin dynamics at the TGN
(a-f) Panels presenting the indicated proteins as in Figure 1. Scale bar = 2 μm. Time to acquire one image pair was 1.1-1.3 s. (a) GPY4933, (b) GPY4934, (c) GPY4935, (d) GPY4931, (e) GPY4932, (f) GPY4936.
Figure 4
Figure 4. TGN PI4P dynamics depend on Arf1p and Gga proteins
Panels presenting the indicated strains as described for Figure 1. Scale bar = 1 μm. Time to acquire one image pair was between 1.0-1.2s. GFP-PH (GFP-PHOSH1). (a) GPY4937, (b) GPY4938, (c) GPY4939, (d) GPY4955.
Figure 5
Figure 5. Depletion of PI4P alters localization of AP-1 and Ent5p
Representative still images from live cells of (a, d) GGA2-mRFP ENT3-GFP pik1-83ts (GPY4940), (b, e) GGA2-mRFP ENT5-GFP pik1-ts83 (GPY4941) and (c, f) GGA2-mRFP β1-GFP pik1-ts83 (GPY4942) incubated at 24°C (a-c) or shifted for 30 min. to 37°C (d-f). (g) Top panel: still image from live cells of GPY4942 shifted to 37°C for 30 min. White arrowhead highlights puncta in kymograph in the bottom panel. Scale bar = 2 μm. Bottom panel: three channel kymograph of the selected puncta; time to acquire one image pair was 1.2s. Every other image pair is shown in the kymograph. (h) Gga2p-mRFP colocalization with β1-GFP (GPY4942) or Ent3-GFP (GPY4940) was quantified in pik1-83ts cells at 24°C (grey bars) or after shift to 37°C for 30 min. (black bars). Error bars are standard error (S.E.M.); n is the number of events; *** denotes p < 0.001, n.s. denotes non-significant (two-tailed t-test).
Figure 6
Figure 6. Pik1p/Frq1p overexpression enhances co-localization of sequentially-recruited clathrin adaptors with functional consequences
(a-c) Representative still images from live cells of the following strains: (a) GPD-PIK1 GPD-FRQ1 β1-GFP GGA2-mRFP (GPY4943), (b) GPD-PIK1 GPD-FRQ1 ENT3-GFP ENT5-mRFP (GPY4944), (c) GPD-PIK1 GPD-FRQ1 ENT3-GFP GGA2-mRFP (GPY4945). Scale bar = 2 μm. (d) Colocalization of the indicated adaptors was quantified in wild-type (wt) and Pik1p/Frq1p overexpressing strains. Left two bars: GPY3109 (grey bar) vs GPY4943 (black bar); Middle 2 bars: GPY3912 (grey bar) vs GPY4944 (black bar); Right two bars: GPY3954 (grey bar) vs GPY4945 (black bar). Error bars are standard error (S.E.M.); n is the number of events; ** denotes p < 0.005, n.s. denotes non-significant (two tailed t-test). (e) Secreted α-factor immunoprecipitated from the media of radiolabelled cells. Lane 1: wild-type (WT, SEY6210), Lane 2: GGA2-mRFP β1-GFP (WT, GPY3109), Lane 3: GPD-PIK1 GPD-FRQ1 (GPY 4961), Lane 4: GPD- PIK1 GPD-FRQ1 GGA2-mRFP β1-GFP (GPY4943). (f) Pulse-chase immunoprecipitation of CPY. Cells from WT (SEY 6210) and GPD-PIK1 GPD-FRQ1 (GPY4961) were metabolically labeled with [35S]methionine- cysteine for 10 min at 24°C then labeling was quenched with nonradioactive amino acids. Samples of cells were removed at the indicated time points and CPY was immunoprecipitated and analyzed by SDS-PAGE and autoradiography. (g) Endoglycosidase H treatment of CPY. CPY was immunoprecipitated from a 40 min. time point of a pulse-chase as in (f) and analyzed directly (EndoH −) or treated with endoglycosidase H (EndoH +).
Figure 7
Figure 7. Gga2p acts in Pik1p recruitment and binds Pik1p
(a,b) Panels presenting the indicated proteins and strains as for Figure 1. Time to acquire one image pair was 1.3 s. (a) GPY 4968. Dotted lines in upper left panel indicate cell boundaries; (b) GPY 4969. Scale bar =2 μm. (c) Extracts from cells expressing HA-Pik1p (GPY 4966, top panel) or Frq1p-GFP (GPY4967, bottom panel) were incubated with BSA-conjugated or His6-Gga2p-conjugated Sepharose. Bound proteins were eluted and analyzed by SDS-PAGE and immunoblotting. (d) Extracts of cells expressing HA-Pik1p (GPY 4966) were applied to glutathione beads coupled to GST, the indicated GST-Gga2p domains or to GST-Gga2p full length. Bound proteins were analyzed as in c. (e) Recombinant Pik1(aa80-720)-His6 was incubated with glutathione-Sepharose coupled to GST or to GST-Gga2pVHS (VHS). Bound proteins were analyzed as in c. (f) Model for regulation of PI4P and adaptor progression at the TGN. Arrows represent known regulatory interactions. Semicircular arrow indicates positive feedback loop. See text for details. (g) Model for positive feedback between Pik1p and Gga2p. 1. Arf1p and Frq1p are recruited to TGN membranes. 2. Frq1p recruits Pik1p, initiating low levels of PI4P production. Arf1p and PI4P (and cargo, not shown) recruit Gga2p. 3. The VHS domain of Gga2p interacts with Pik1p, helping to recruit or stabilize Pik1p at TGN membranes, thereby promoting PI4P production. 4. Increased PI4P stimulates recruitment of additional Gga2p which in turn further enhances Pik1p association with the TGN.

Comment in

  • Pik1-ing clathrin adaptors.
    Sun Y, Drubin DG. Sun Y, et al. Nat Cell Biol. 2012 Feb 19;14(3):231-2. doi: 10.1038/ncb2448. Nat Cell Biol. 2012. PMID: 22344031

References

    1. Traub LM. Common principles in clathrin-mediated sorting at the Golgi and the plasma membrane. Biochim Biophys Acta. 2005;1744:415–437. - PubMed
    1. Duncan MC, Payne GS. ENTH/ANTH domains expand to the Golgi. Trends Cell Biol. 2003;13:211–215. - PubMed
    1. Black MW, Pelham HRB. A selective transport route from Golgi to late endosomes that requires the yeast GGA proteins. J. Cell Biol. 2000;151:587–600. - PMC - PubMed
    1. Costaguta G, Duncan MC, Fernandez GE, Huang GH, Payne GS. Distinct roles for TGN/endosome epsin-like adaptors Ent3p and Ent5p. Mol. Biol. Cell. 2006;17:3907–3920. - PMC - PubMed
    1. Costaguta G, Stefan CJ, Bensen ES, Emr SD, Payne GS. Yeast Gga coat proteins function with clathrin in Golgi to endosome transport. Mol. Biol. Cell. 2001;12:1885–1896. - PMC - PubMed

Publication types

MeSH terms

Substances