. 2012 Mar 15;125(Pt 6):1591-604.
doi: 10.1242/jcs.097790. Epub 2012 Feb 17.

Contrasting roles of condensin I and condensin II in mitotic chromosome formation

Affiliations

Contrasting roles of condensin I and condensin II in mitotic chromosome formation

Lydia C Green et al. J Cell Sci. .

Abstract

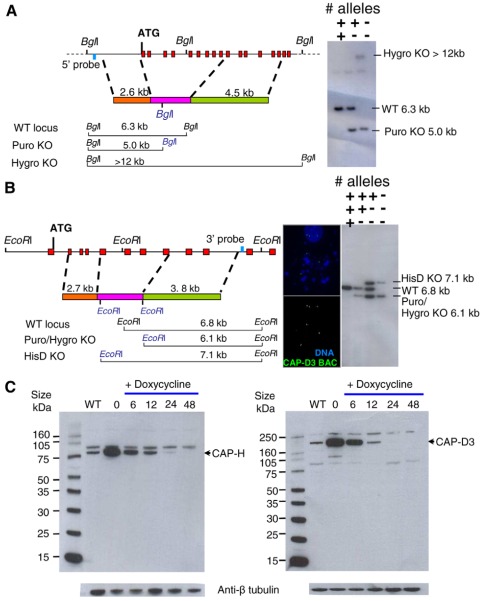
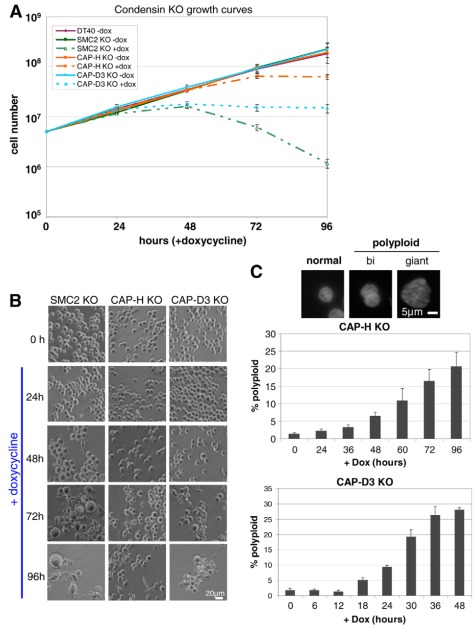
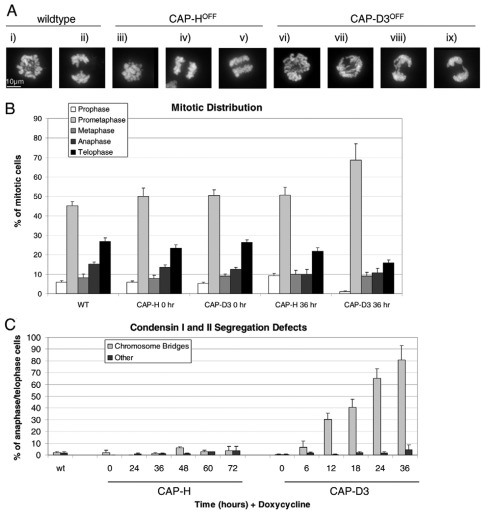
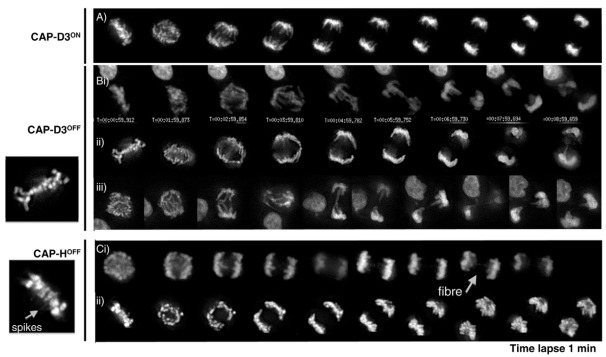
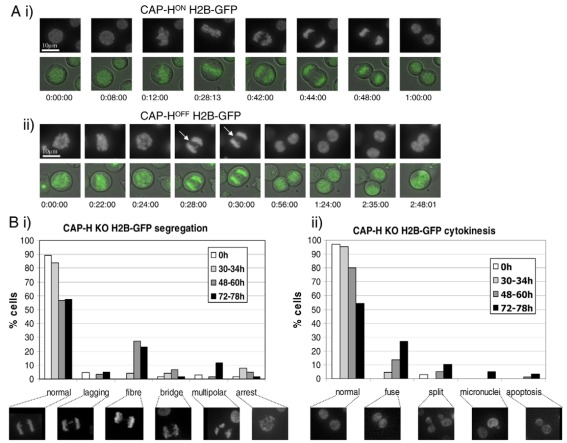
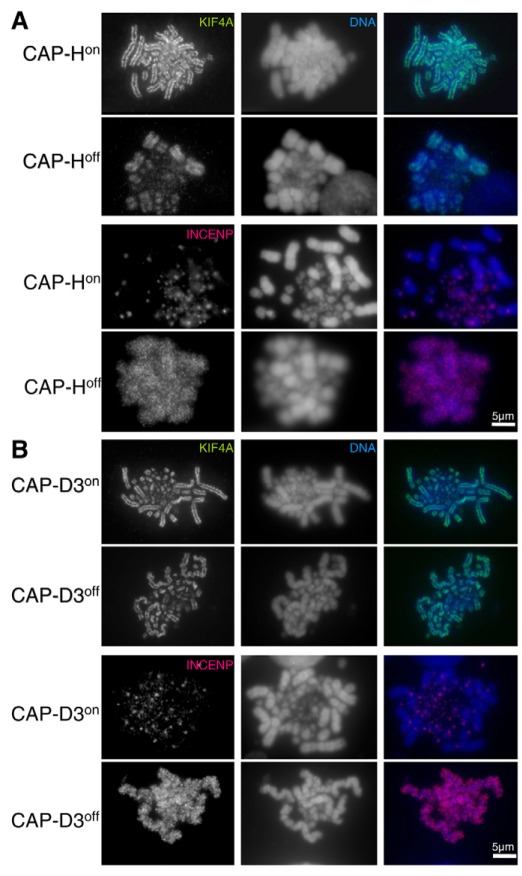
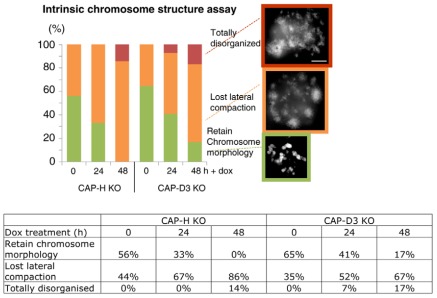
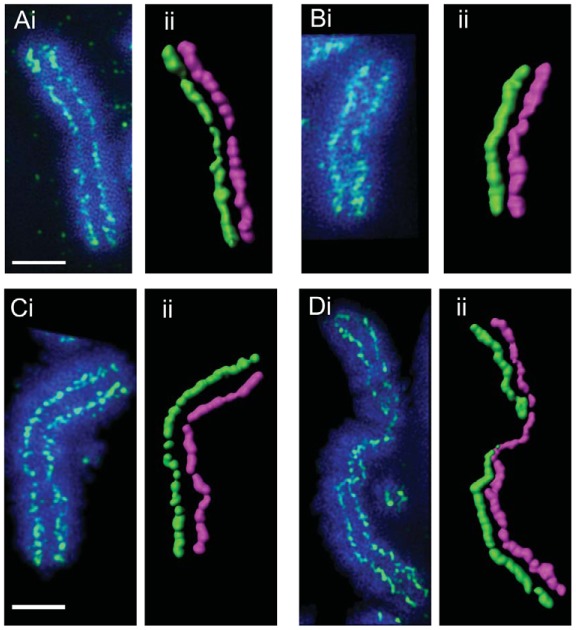
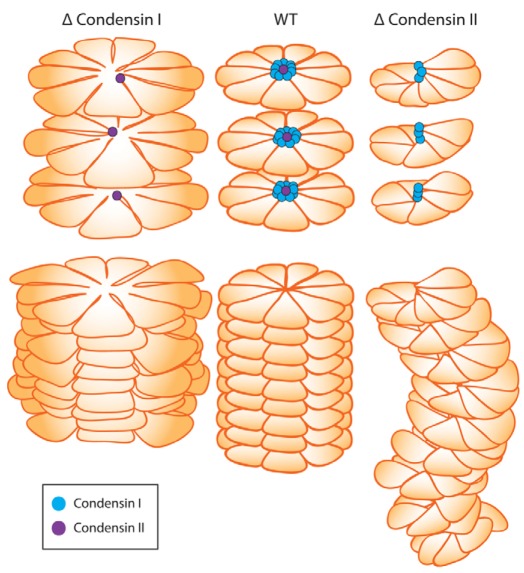
In vertebrates, two condensin complexes exist, condensin I and condensin II, which have differing but unresolved roles in organizing mitotic chromosomes. To dissect accurately the role of each complex in mitosis, we have made and studied the first vertebrate conditional knockouts of the genes encoding condensin I subunit CAP-H and condensin II subunit CAP-D3 in chicken DT40 cells. Live-cell imaging reveals highly distinct segregation defects. CAP-D3 (condensin II) knockout results in masses of chromatin-containing anaphase bridges. CAP-H (condensin I)-knockout anaphases have a more subtle defect, with chromatids showing fine chromatin fibres that are associated with failure of cytokinesis and cell death. Super-resolution microscopy reveals that condensin-I-depleted mitotic chromosomes are wider and shorter, with a diffuse chromosome scaffold, whereas condensin-II-depleted chromosomes retain a more defined scaffold, with chromosomes more stretched and seemingly lacking in axial rigidity. We conclude that condensin II is required primarily to provide rigidity by establishing an initial chromosome axis around which condensin I can arrange loops of chromatin.


Figures

Fig. 1.
Fig. 1.
Generation of CAP-H and CAP-D3 conditional knockout cell lines. (A) Schematic representation of the CAP-H genomic locus and targeting construct. Exons and external screening probe are shown as red and blue boxes, respectively. Orange and green boxes represent 5′ and 3′ targeting arms flanking the resistance cassette (pink box), with the expected band sizes for wild-type (WT) and genomic BglI digests illustrated in the schematic below. Two targeting constructs with puromycin (puro) and hygromycin (hygro) resistance cassettes were used to target each allele. Southern blot analysis shows sequential gene targeting with puromycin followed by hygromycin constructs. The wild-type 6.3-kb BglI band is replaced by 5.0 and >12 kb fragments for puromycin and hygromycin constructs, respectively. (B) Schematic representation of the CAP-D3 genomic locus; boxes are coloured as in A. FISH analysis with a CAP-D3 BAC clone reveals the presence of three copies of the gene in an interphase cell (top 3 signals) and in a metaphase cell (bottom three signals). Each allele was targeted with a separate targeting construct containing a puromycin, hygromycin or histidinol dehydrogenase (HisD) selectable marker. Southern blot analysis shows the sequential targeting for each allele. The wild-type 6.8-kb EcoRI fragment is replaced by 6.1 kb for the puromycin and hygromycin constructs, and 7.1 kb for the HisD construct. (C) Western blot analysis of SDS-PAGE gels probed with rabbit polyclonal antibodies against CAP-H or CAP-D3. CAP-H- and CAP-D3-specific bands are indicated. Anti-β-tubulin was used as a loading control.
Fig. 2.
Fig. 2.
Growth analysis of CAP-H and CAP-D3 knockout cell lines. (A) Growth curves of parental DT40 cells and CAP-H and CAP-D3 knockout (KO) cell lines in the presence or absence of doxycycline (dox). (B) Phase-contrast images of SMC2, CAP-H and CAP-D3 KO cell lines in the absence or presence of doxycycline for up to 96 hours. (C) Scoring of polyploid cells for condensin KOs. PFA-fixed, DAPI-stained cells counterstained with antibodies against lamin B1 or β-tubulin were used to quantify the amount of binucleate or giant cells (grouped together as polyploid cells) and expressed as a percentage of the total population. Examples of DAPI images of normal-sized, binucleate and giant cells are presented above. Error bars represent the standard error.
Fig. 3.
Fig. 3.
Mitotic stage analysis and chromosome segregation defects. (A) PFA-fixed cells stained with DAPI showing metaphase (i, iii and vi) and anaphase cells (ii, iv, v and vii–ix), revealing the presence of chromosome-segregation defects mainly in CAP-D3 knockout (KO) cell lines (vii–ix). (B) Mitotic-stage analysis of wild-type (WT), CAP-H and CAP-D3 KO cell lines, with and without doxycycline at 0 and 36 hours (see supplementary material Fig. S3 for a more detailed time-course distribution). PFA-fixed mitotic cells were stained with DAPI and probed with antibodies against phosphoserine 10 histone H3and lamin B1 or INCENP and β-tubulin as cell cycle markers. (C) Chromosome-segregation defect analysis in CAP-H and CAP-D3 KO cell lines. The major chromosome-segregation defects visible under PFA fixation and DAPI staining were divided into two categories and scored as a percentage of total anaphase and telophase cells: chromosome bridges and ‘other’ (defined as anaphases with lagging chromosomes or multipolar anaphases with chromosomes separating to more than two spindle poles). Error bars represent the standard error.
Fig. 4.
Fig. 4.
Mitotic live-cell imaging analysis. (A) CAP-D3ON cell line. (B) CAP-D3OFF cell line, showing images for three different mitoses (i–iii), with examples of chromatid bridges, and a close-up of metaphase chromosomes shown on the left. (C) CAP-HOFF cell line, showing images for two different mitoses (i,ii), with fine chromatin fibres indicated by arrow, and a close-up of metaphase chromosomes (arrowhead) showing radiating chromatin fibres or ‘spikes’. Both CAP-HOFF and CAP-D3OFF cell lines were treated with doxycycline for 30 hours. Live-cell imaging was performed on conditional knockout cell lines containing the transgene encoding H2B–GFP. Images were captured every minute.
Fig. 5.
Fig. 5.
Live-cell imaging analysis of CAP-H knockout H2B–GFP cell lines. (A) Comparison of CAP-H KO cell line (i) without and (ii) with doxycycline (+ 52 hours). The cell line contains the transgene encoding H2B–GFP. Fluorescence and DIC images are shown for each mitotic series. Note that, in (ii), a thread appears (white arrow) during anaphase, and the daughter cells fuse (last panel) approximately two hours after telophase. These are the two most common segregation and cytokinesis defects in CAP-HOFF cells. (B) Quantitative live-cell analysis of CAP-H KO:H2B–GFP cell line. (i) Chromosome-segregation defects are shown in the following categories: chromosome lagging, chromatin fibre, chromosome bridge, multipolar anaphases and mitotic arrest (representing cells in mitosis for over 2 hours). (ii) Cytokinesis defects are shown in the following categories: cell fusion, split (which represents separated chromatids that undergo a further division during telophase or cytokinesis), micronuclei and apoptosis. Representative images of each defect category are shown below the bar chart. The following numbers of cells or independent movies were scored for each time-point: N=66 (0 hours dox), N=21 (+dox 30–34h), N=49 (+dox 48–60h) and N=31 (+dox 72–78h).
Fig. 6.
Fig. 6.
Localisation of the chromosomal proteins KIFA and INCENP. (A) Methanol:acetic-acid-fixed CAP-HON and CAP-HOFF metaphase cells immunostained with antibodies against either KIF4A or INCENP. (B) CAP-D3ON and CAP-D3OFF metaphase cells were fixed and stained as above. CAP-HOFF and CAP-D3OFF cells were treated with doxycycline for 48 hours. In both cell lines, KIF4A (green) and INCENP (red) are shown in the left column, DNA stained with DAPI (blue) is shown in the middle column, and a merge of DNA and either KIF4A or INCENP is shown in the right column.
Fig. 7.
Fig. 7.
Intrinsic metaphase structure (IMS) assay. Chromosome morphology of TEEN-treated CAP-H and CAP-D3 KO cells were grouped into the following categories, ranging from less to more disorganized: ‘retain chromosome morphology’, ‘lost lateral compaction’ and ‘totally disorganized’. Representative images from each category are shown, the data were tabulated below and scored from the following numbers of metaphases: CAP-H 0 hours doxycycline (dox; N=16), CAP-H +dox 24 hours (N=15), CAP-H +dox 48 hours (N=14), CAP-D3 0 hours dox (N=17), CAP-D3 +dox 24 hours (N=27), CAP-D3 +dox 48 hours (N=24). Chromosomes were stained with DAPI (white). All images are at the same scale. Scale bar: 5 μm.
Fig. 8.
Fig. 8.
Super-resolution microscopy (3D-SIM) analysis of condensin I and II knockout mitotic chromosomes. (A,B) 3D-SIM images of CAP-HON and CAP-HOFF and (C,D) CAP-D3ON and CAP-D3OFF metaphase chromosomes. Methanol:acetic-acid-fixed chromosomes were immunostained with antibodies against KIF4A and counterstained with DAPI. Surface rendering of KIF4A-stained metaphase chromosomes is shown in the images labelled ‘ii’. Each sister chromatid is pseudo-coloured in separate colours in order to highlight the metaphase chromosome scaffold. Scale bars: 2 μm.
Fig. 9.
Fig. 9.
A model displaying the contrasting roles of condensin I and II. Based on proteomics data showing a 10:1 ratio of condensin I to condensin II on mitotic chromosomes (Ohta et al., 2010) and our own results, we propose the following unifying model for condensin I and II function in mitotic chromosomes. The size of condensin I and II reflects the known size relative to DNA based on atomic force measurements (Anderson et al., 2002; Yoshimura et al., 2002). Top panel: individual rosette layers showing localisation of condensin I and II. Bottom: rosette layers stacked together showing the effect on longitudinal axial compaction in the presence and absence of condensins. We propose that, in wild-type mitotic chromosomes, condensin I stabilises and nucleates short-range loops, promoting compaction of chromosome rosettes. Condensin II provides the long-range linkage and alignment between the rosettes, thus facilitating chromosome longitudinal compaction. Chromosomes deficient of condensin I (Δ condensin I) are unable to link and nucleate short-range loops, resulting in a fatter and disorganized chromosome scaffold. Chromosomes deficient of condensin II (Δ condensin II) are unable to provide regular structural linkage between rosettes. Discrete rosettes are unable to form, resulting in a thinner chromosome lacking structural integrity.

References

    1. Abe S., Nagasaka K., Hirayama Y., Kozuka-Hata H., Oyama M., Aoyagi Y., Obuse C., Hirota T. (2011). The initial phase of chromosome condensation requires Cdk1-mediated phosphorylation of the CAP-D3 subunit of condensin II. Genes Dev. 25, 863-874 - PMC - PubMed
    1. Adams R. R., Maiato H., Earnshaw W. C., Carmena M. (2001). Essential roles of Drosophila inner centromere protein (INCENP) and aurora B in histone H3 phosphorylation, metaphase chromosome alignment, kinetochore disjunction, and chromosome segregation. J. Cell Biol. 153, 865-880 - PMC - PubMed
    1. Adolph K. W., Cheng S. M., Paulson J. R., Laemmli U. K. (1977). Isolation of a protein scaffold from mitotic HeLa cell chromosomes. Proc. Natl. Acad. Sci. USA 74, 4937-4941 - PMC - PubMed
    1. Anderson D. E., Losada A., Erickson H. P., Hirano T. (2002). Condensin and cohesin display different arm conformations with characteristic hinge angles. J. Cell Biol. 156, 419-424 - PMC - PubMed
    1. Baron U., Gossen M., Bujard H. (1997). Tetracycline-controlled transcription in eukaryotes: novel transactivators with graded transactivation potential. Nucleic Acids Res. 25, 2723-2729 - PMC - PubMed

Publication types

MeSH terms