. 2012 May 1;125(Pt 9):2300-14.
doi: 10.1242/jcs.100032. Epub 2012 Feb 17.

Supervillin couples myosin-dependent contractility to podosomes and enables their turnover

Affiliations

Supervillin couples myosin-dependent contractility to podosomes and enables their turnover

Ridhirama Bhuwania et al. J Cell Sci. .

Abstract

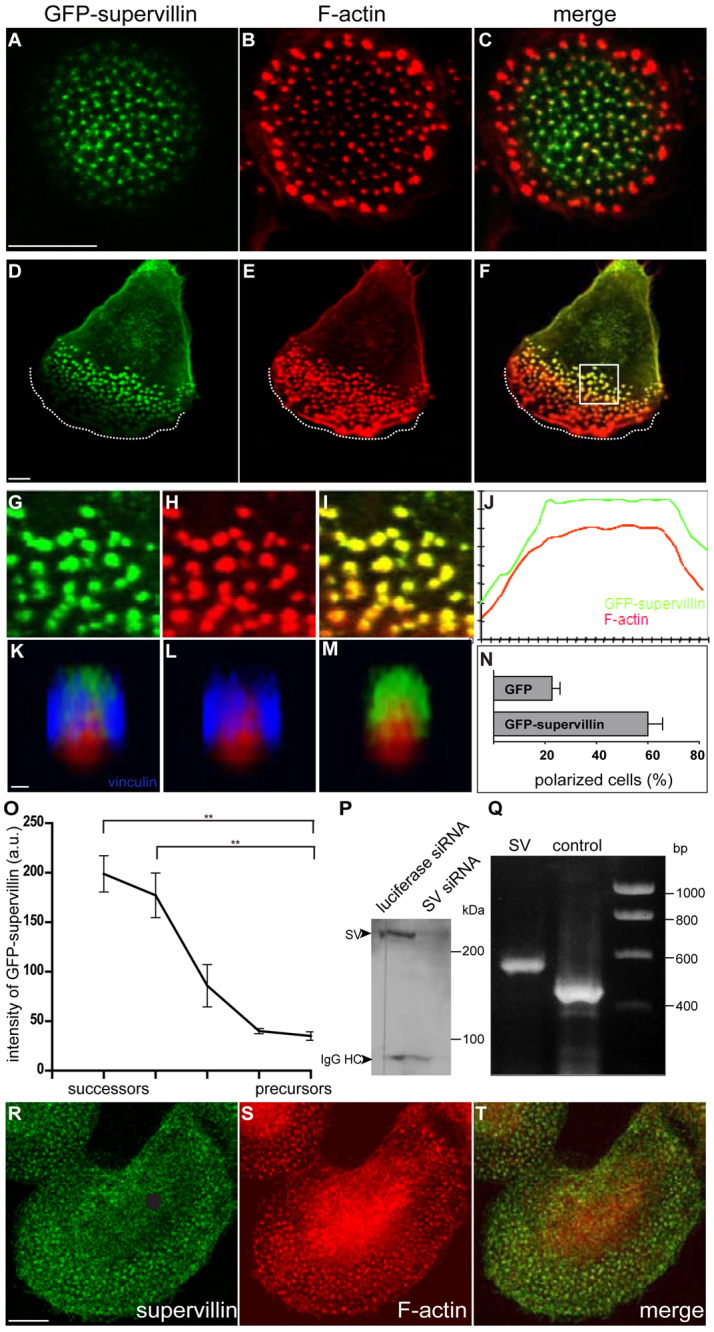
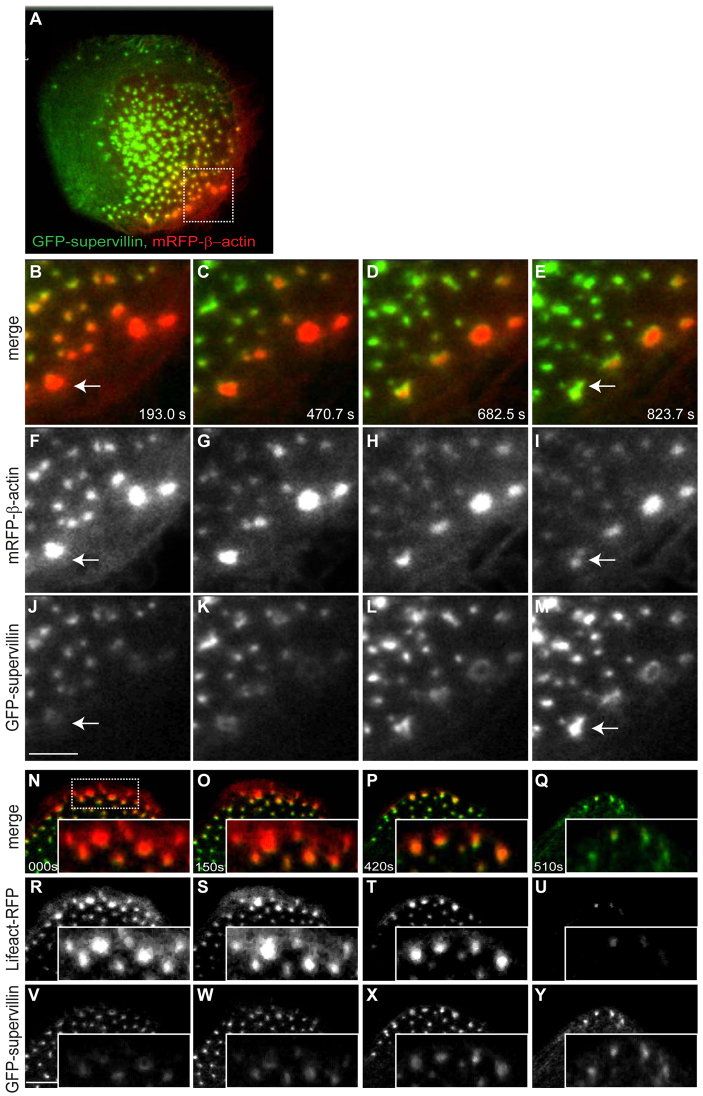
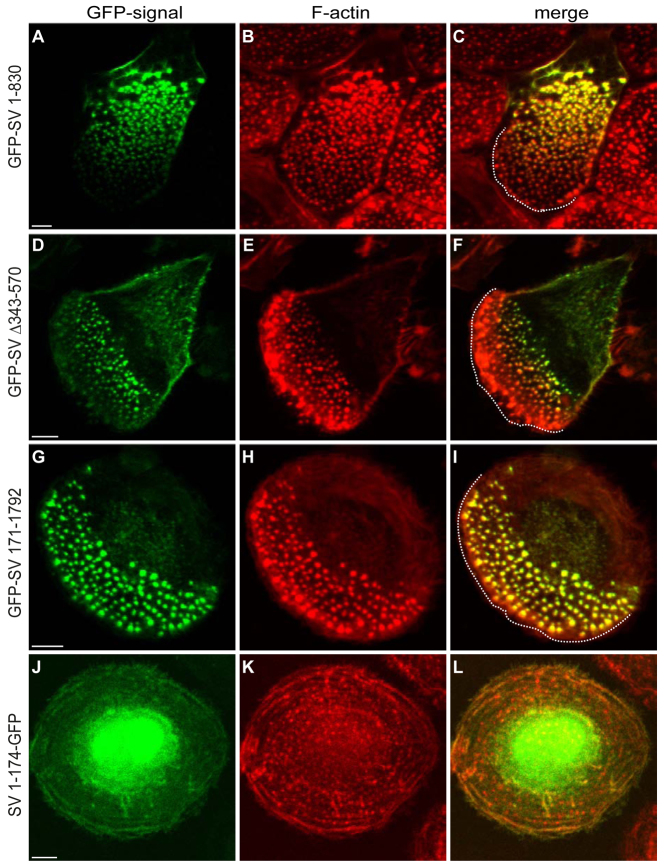
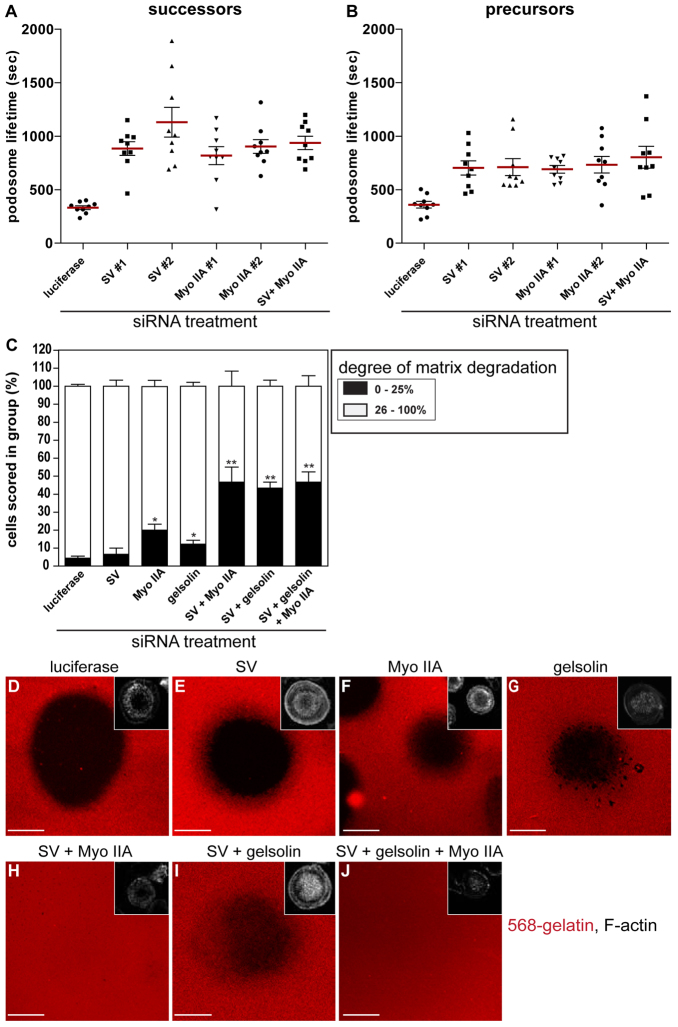
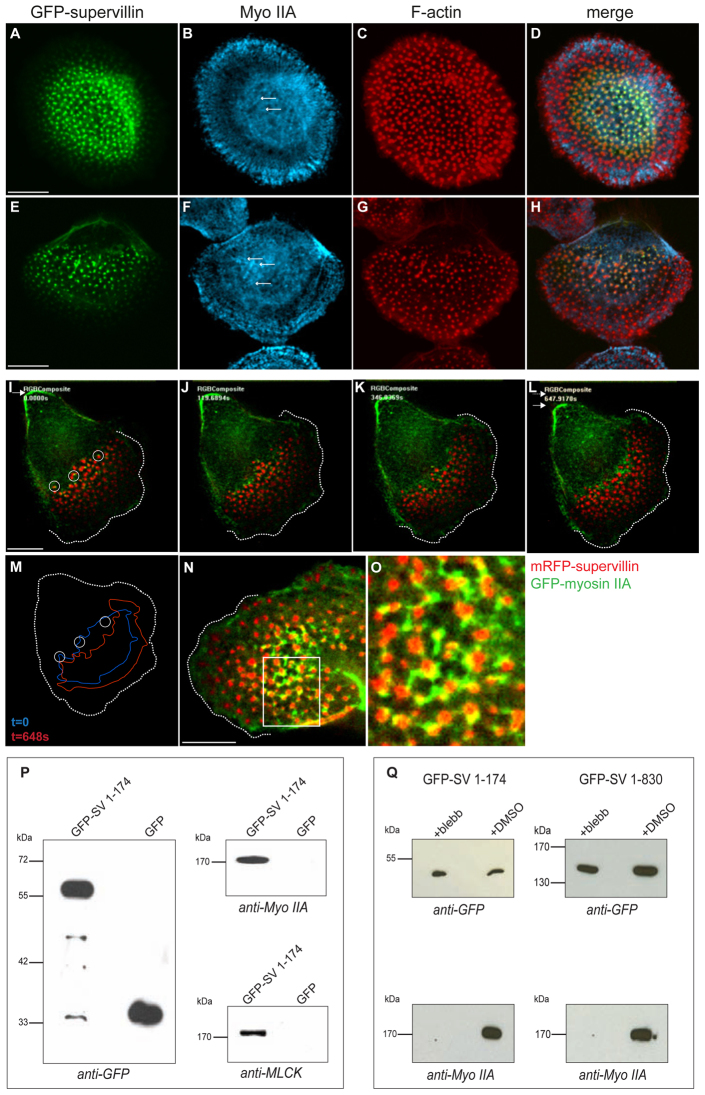
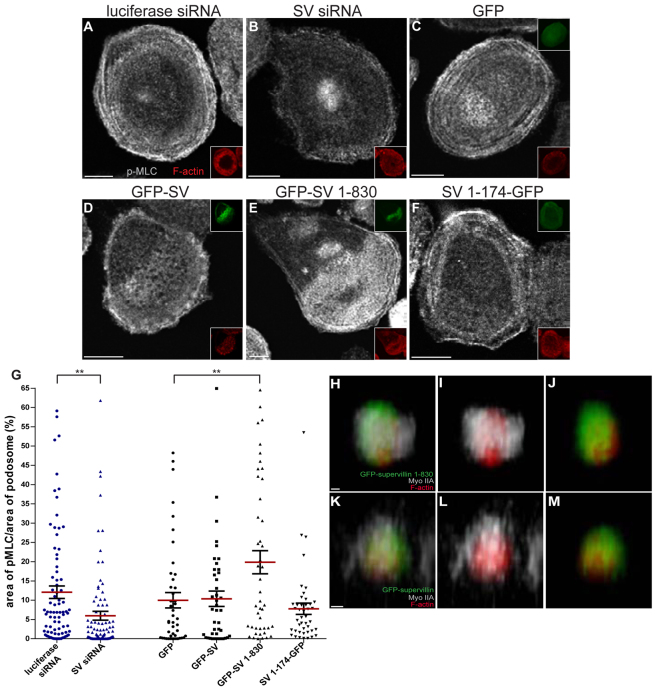
Podosomes are actin-rich adhesion and invasion structures. Especially in macrophages, podosomes exist in two subpopulations, large precursors at the cell periphery and smaller podosomes (successors) in the cell interior. To date, the mechanisms that differentially regulate these subpopulations are largely unknown. Here, we show that the membrane-associated protein supervillin localizes preferentially to successor podosomes and becomes enriched at precursors immediately before their dissolution. Consistently, podosome numbers are inversely correlated with supervillin protein levels. Using deletion constructs, we find that the myosin II regulatory N-terminus of supervillin [SV(1-174)] is crucial for these effects. Phosphorylated myosin light chain (pMLC) localizes at supervillin-positive podosomes, and time-lapse analyses show that enrichment of GFP-supervillin at podosomes coincides with their coupling to contractile myosin-IIA-positive cables. We also show that supervillin binds only to activated myosin IIA, and a dysregulated N-terminal construct [SV(1-830)] enhances pMLC levels at podosomes. Thus, preferential recruitment of supervillin to podosome subpopulations might both require and induce actomyosin contractility. Using siRNA and pharmacological inhibition, we demonstrate that supervillin and myosin IIA cooperate to regulate podosome lifetime, podosomal matrix degradation and cell polarization. In sum, we show here that podosome subpopulations differ in their molecular composition and identify supervillin, in cooperation with myosin IIA, as a crucial factor in the regulation of podosome turnover and function.


Figures

Fig. 1.
Fig. 1.
Supervillin is expressed in primary human macrophages and localizes to a substructure of successor podosomes. (AF) Confocal immunofluorescence micrographs of 7 day cultured primary human macrophages, in a quiescent (A–C) or polarized (D–F) state, that express GFP–SV (green; A,D), and are stained for F-actin (red; B,E); merged images shown in C,F. Dashed white lines in D–F indicate the leading edge of this polarized cell. (G–I) Enlarged areas indicated by white box in F. Note absence of GFP–SV from precursors (cell periphery of migratory cell or leading edge of polarized cell). (J) Plots of fluorescence intensity for a single podosome; GFP–SV (green), F-actin (red). (KM) 3D reconstruction of z-stacks of a single podosome from a macrophage expressing GFP–SV. Note cap-like distribution of GFP–SV (green) on top of the F-actin–rich podosome core (red), surrounded by a ring of vinculin (blue; see also supplementary material Movie 1). (N) Cell polarization in cells expressing GFP or GFP–SV. For each value, 3×30 cells were evaluated; cells showing distinct leading and trailing edges (D–F), were scored as ‘polarized’. Polarization for cells expressing GFP: 22.2±1.4%, polarization for cells expressing GFP–SV: 61.1±2.8%, with P<0.01 according to Student's t-test. (O) Intensity of podosomal GFP–SV at five different locations between the cell interior and cell edge; locations of successor and precursor podosomes are indicated. Intensities were measured in 13 cells from three different donors. **P<0.01. (P) Western blot of macrophage lysate stained with supervillin-specific H340 antibody. Molecular sizes in kDa are indicated. Supervillin (SV) is indicated by an arrowhead. Left lane: lysate from macrophages treated with luciferase-specific siRNA as control; right lane: lysate from macrophages treated with supervillin-specific siRNA to demonstrate antibody specificity; β-actin loading control (supplementary material Fig. S8A). (Q) RT-PCR from macrophage mRNA using supervillin- or actin- (as a control) specific primers. Bands of the expected sizes (521 bp for supervillin, 445 bp for actin) are detected on an agarose gel stained with ethidium bromide. Molecular sizes in base pairs (bp) are indicated. (RT) Confocal immunofluorescence micrographs of 7d cultured primary human macrophages, stained for supervillin (green) with specific antibody (R) and for F-actin (red) with Alexa-Fluor-568-labeled phalloidin (S); merge in T. Scale bars: 10 μm (A–F,R–T) and 0.2 μm (K–M).
Fig. 2.
Fig. 2.
Dissolving podosomes acquire GFP–SV. (AM) Still images from confocal time-lapse video of a 7 day cultured macrophage expressing mRFP–β-actin (red) and GFP–SV (green) for 18 hours (supplementary material Movie 2). (A) Note absence of GFP–SV from large podosome precursors at the leading edge (lower right). White box indicates area shown in B–M, with merged images (B–E) containing the mRFP–β-actin signals (F–I) in red and the GFP–SV signals (J–M) in green. White arrows indicate a dissolving podosome, where disappearance of the mRFP–β-actin signal is coupled with enrichment of GFP–SV. Time since start of the experiment is indicated in seconds. (NY) Still images from a confocal time-lapse video of a 7 day cultured macrophage expressing mRFP–Lifeact (red) and GFP–SV (green) for 18 hours (supplementary material Movie 3). White box indicates area enlarged in N–Y, with merged images (N–Q) containing the mRFP–Lifeact signals (R–U) in red and the GFP–SV signals (V–Y) in green. Note the appearance of supervillin at precursors concomitant with the dissolution of the F-actin signal, as the cell begins to withdraw. Time since start of the experiment is indicated in seconds. Scale bars: 5 μm (B–M) and 10 μm (N–Y).
Fig. 3.
Fig. 3.
Podosome numbers in macrophages expressing the designated supervillin constructs. (A) Supervillin contains a myosin IIA and L-MLCK binding domain (red; aa 1–174), three F-actin binding regions (white, yellow, navy; aa 174–343, 343–571, 571–830) that partially overlap with cortactin-binding sites (aa 1–340, 571–830), a central region with a strong nuclear localization signal (NLS, white: aa 830–1010) and a C-terminal region with similarities to gelsolin and villin (light blue). The second F-actin binding region binds TRIP-6 whereas more C-terminal regions interact with the podosome protein Tks5, kinesins, calponin and cell cycle regulatory proteins (Smith et al., 2010). The supervillin N- and C-termini are indicated; numbers indicate amino acid residues at the start or end of each GFP fusion construct. Reduction of podosome numbers upon overexpression of respective constructs is indicated on the right (level of reduction indicated by +++, ++ and +). (BG) Podosome numbers in macrophages expressing supervillin constructs (n=3×30). GFP–SV (C) and SV(Δ343–570) (F) greatly decrease podosome numbers, an ability lost after deletion of the myosin II-activating domain in SV(171–1792) (D). The isolated SV(174–343) region also reduces podosome numbers (G), probably by acting as a competitive binder for full-length supervillin (supplementary material Fig. S7). *P<0.05; **P<0.01. For specific values, see supplementary material Table S1. Data for the other constructs, see supplementary material Fig. S4.
Fig. 4.
Fig. 4.
Subcellular localization of supervillin deletion mutants. (AL) Confocal immunofluorescence micrographs of 7 day cultured primary human macrophages expressing GFP-tagged supervillin constructs shown in Fig. 3A: (A–C) SV(1–830), (D–F) SV(Δ343–570), (G–I) SV(171–1792), or (J–L) SV(1–174). GFP signals in green (A,D,G,J); F-actin in red (B,E,H,K); merges in C,F,I,L. Dashed white lines indicate leading edges of the cells. Scale bar: 10 μm. Note the presence of the SV(171–1792) construct at precursors at the leading edge (I).
Fig. 5.
Fig. 5.
Supervillin and myosin IIA regulate podosome lifetime and matrix degradation. (A,B) Lifetimes of successor (A) or precursor (B) podosomes in macrophages expressing Lifeact–GFP after transfection with indicated siRNAs (control: luciferase siRNA). Each value represents an average lifetime of at least ten podosomes in a single cell (n=9). (Note that only those precursors that formed and dissolved within the experimental period were evaluated.) All values (mean ± s.e.m.) are significantly different from respective controls with at least P<0.001, as determined by one-way ANOVA. (C) Summary of matrix degradation under cells treated with designated siRNAs. Degree of matrix degradation was analyzed by fluorescence measurements of 3×30 cells. Complete absence of labeled matrix beneath cells was set as 100% degradation. Cells were scored into groups according to matrix degradation (0–25%; 26–100%). *P<0.05; **P<0.01 as determined by one-way ANOVA. Specific values for A and B, see supplementary material Table S1. (DJ) Confocal laser-scanning micrographs of macrophages transfected with (D) siRNA against luciferase as a control or with siRNA specific for (E) supervillin, (F) myosin IIA, (G) gelsolin or (H–J) combinations of specific siRNAs, as indicated. Cells were seeded on Rhodamine-labeled gelatin matrix (red). Matrix degradation is visible as dark areas; insets show F-actin staining with Alexa-Fluor-647-labeled phalloidin (white). Scale bars: 10 μm.
Fig. 6.
Fig. 6.
Myosin IIA cables connect supervillin-positive podosomes. Colocalization of tagged supervillin with endogenous and co-expressed GFP–myosin IIA in unpolarized and polarized macrophages. (AH) Confocal micrographs of macrophages expressing GFP–SV (A,E) and stained for myosin IIA (B,F) and for F-actin (C,G); merged images shown in D,H. Scale bars: 10 μm. (IO) GFP–myosin-IIA overlaps with mRFP–SV at dissolving successor podosomes. Still images from confocal time-lapse videos of 7 day cultured macrophages expressing GFP–myosin IIA (green) and mRFP–SV (red). Cell showing moderate overexpression is shown in I–L (supplementary material Movie 4); cell with more pronounced overexpression is shown in N,O (supplementary material Movies 5, 6). Dashed white lines indicate position of the leading edge in I–L,N and total cell circumference in M. Solid white arrow indicates current position of the trailing edge in I,L, dashed white arrow indicates its prior position (L). Enrichment of GFP–myosin IIA at podosomes at the rear of the podosome field often precedes their disappearance (white circles). (M) Net movement of the mRFP–SV-marked podosome field between time point 0 seconds (blue line) and time point 648 seconds (red line). As rearward podosomes dissolve, more forward-positioned podosomes acquire mRFP–SV. (N,O) GFP–myosin IIA-positive cables contact mRFP–SV-rich podosomes at the rear of the podosome field. (O) Enlargement of the area indicated by the white box in N. Note that a network of GFP–myosin-IIA connects mRFP–SV-positive podosomes. Scale bars: 10 μm. (P,Q) Macrophage supervillin interacts with myosin IIA and MLCK. Macrophage lysates were immunoprecipitated with anti-GFP antibody coupled to magnetic beads. (P) Western blots of (left) lysates from macrophages expressing GFP–SV(1–174) or GFP as a control and (right) anti-GFP immunoprecipitates. Staining with anti-GFP antibody (left), anti-myosin IIA antibody (top right), or anti-MLCK antibody (bottom right). Left lanes: cells expressing GFP–SV(1–174), right lanes: GFP control. (Q) Western blots of (top panels) lysates and (bottom panels) anti-GFP immunoprecipitates from macrophages expressing GFP–SV(1–174) (left) or GFP–SV(1–830) (right), treated with either 10 μM blebbistatin or 0.035% DMSO prior to lysis. Blots were developed with anti-GFP antibody (top blots) or anti-myosin IIA antibody (bottom blots). Molecular sizes in kDa are indicated to the left of each panel.
Fig. 7.
Fig. 7.
The supervillin N-terminal 830 residues induce myosin light chain phosphorylation (pMLC) and myosin condensation at podosomes. (AF) Confocal micrographs of macrophages transfected with supervillin- or luciferase-specific siRNA, or expressing GFP, GFP–SV, GFP–SV(1–830) or GFP–SV(1–174), as indicated, and stained for pMLC. Insets in red show F-actin staining; insets in green in C–F show GFP signal. (G) Enrichment of pMLC at podosomes in cells treated with the indicated siRNA or expressing the indicated supervillin constructs. Mean ± s.e.m. **P<0.01, as determined by Mann–Whitney test (n=3×15 for overexpressing cells, 3×30 for siRNA-treated cells). (HM) 3D reconstruction of optical z-stacks of single podosomes from macrophages expressing GFP–SV(1–830) (H–J) or GFP–SV (K–M) co-stained for myosin IIA (white) and F-actin (red). (Also see supplementary material Movies 7, 8.) Note cap-like localizations of supervillin constructs above F-actin cores and the more compact localization of myosin IIA at the GFP–SV(1–830)-decorated podosome. Scale bars: 10 μm (A–F) and 0.15 μm (H–M).
Fig. 8.
Fig. 8.
Supervillin localization and supervillin-induced cell polarization require myosin IIA. (AR) Confocal micrographs of macrophages expressing GFP–SV (green) after transfection with the indicated siRNA (A–L) or treatment with 0.007% DMSO (M–O) or 2 μM blebbistatin (P–R) and staining for F-actin to visualize podosome cores (red); merged images (C,F,I,L,O,R). Scale bars: 10 μm. (S) Differential localization of GFP–SV at podosome subpopulations in siRNA- or drug-treated cells. Cells were scored into groups: localization of GFP–SV at successors only (black bars), preferentially at successors (grey bars), or at both precursors and successors (white bars). Mean ± s.e.m. *P<0.05; **P<0.01, as determined by Student's t-test. (T) Polarity of control cells (unlabeled) or cells expressing GFP–SV (brackets) after treatment with specific siRNA or drugs, as indicated. Cell polarization was judged by the presence of leading and trailing edges, with accompanying recruitment of podosomes to the leading edge, as opposed to unpolarized, radially symmetrical cells showing podosomes along the entire cell periphery. Mean ± s.e.m. *P<0.05; **P<0.01, as determined by unpaired Student's t-test. For each value in S and T, 3×30 cells were evaluated. For specific values for S and T, see supplementary material Table S1.
Fig. 9.
Fig. 9.
Model of supervillin- and myosin-IIA-regulated turnover of podosomes. Polarized macrophage shows larger precursors at the leading edge and smaller successors at the trailing edge (top). L-MLCK is present in both podosome subpopulations, whereas only successors contain supervillin and myosin IIA and are connected to actomyosin cables. As the cell changes polarity, enhanced local contractility leads to higher levels of supervillin and contractile myosin IIA at successors, whereas precursors lying in the contractile zone acquire both proteins (middle). Enhanced local contractility also can increase cell polarity in a positive-feedback loop. Podosomes that have acquired higher levels of supervillin and contractile myosin IIA at the new trailing edge dissolve, whereas precursors form at the new leading edge (bottom).

References

    1. Abramoff M. D., Magalhaes P. J., Ram S. J. (2004). Image processing with ImageJ. Biophotonics International 11, 36-42
    1. Alexander N. R., Branch K. M., Parekh A., Clark E. S., Iwueke I. C., Guelcher S. A., Weaver A. M. (2008). Extracellular matrix rigidity promotes invadopodia activity. Curr. Biol. 18, 1295-1299 - PMC - PubMed
    1. Arora P. D., Wang Y., Janmey P. A., Bresnick A., Yin H. L., McCulloch C. A. (2011). Gelsolin and non-muscle myosin IIA interact to mediate calcium-regulated collagen phagocytosis. J. Biol. Chem. 286, 34184-34198 - PMC - PubMed
    1. Blanchoin L., Pollard T. D., Hitchcock-DeGregori S. E. (2001). Inhibition of the Arp2/3 complex-nucleated actin polymerization and branch formation by tropomyosin. Curr. Biol. 11, 1300-1304 - PubMed
    1. Bowden E. T., Onikoyi E., Slack R., Myoui A., Yoneda T., Yamada K. M., Mueller S. C. (2006). Co-localization of cortactin and phosphotyrosine identifies active invadopodia in human breast cancer cells. Exp. Cell Res. 312, 1240-1253 - PubMed

Publication types

MeSH terms