

Sphingosine-1-phosphate receptor-3 signaling up-regulates epidermal growth factor receptor and enhances epidermal growth factor receptor-mediated carcinogenic activities in cultured lung adenocarcinoma cells
- PMID: 22344462
- PMCID: PMC3797598
- DOI: 10.3892/ijo.2012.1379
Sphingosine-1-phosphate receptor-3 signaling up-regulates epidermal growth factor receptor and enhances epidermal growth factor receptor-mediated carcinogenic activities in cultured lung adenocarcinoma cells
Abstract
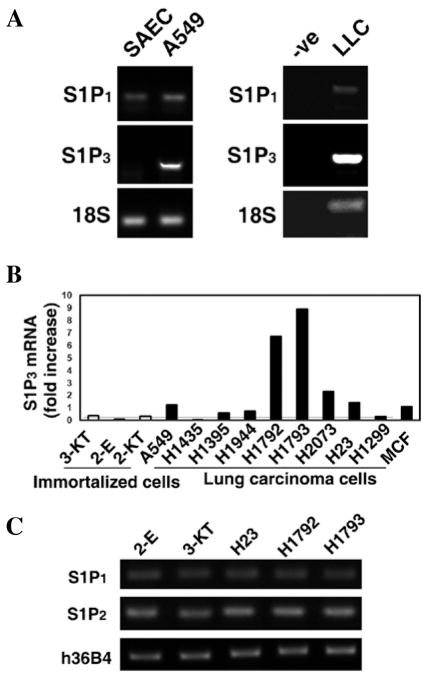
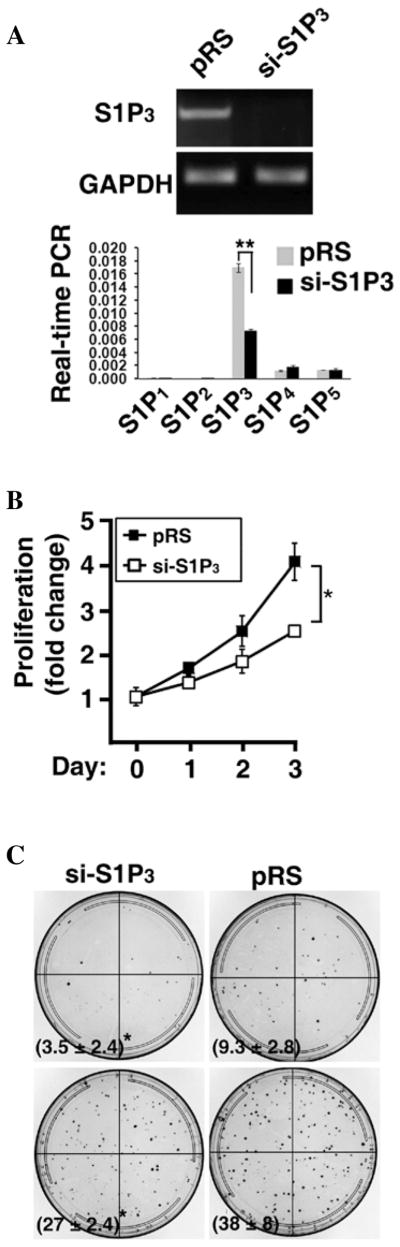
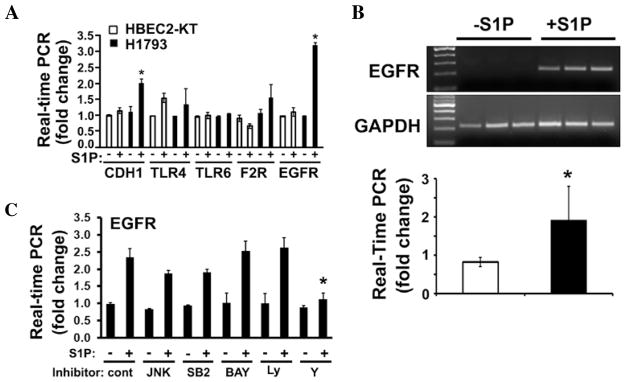
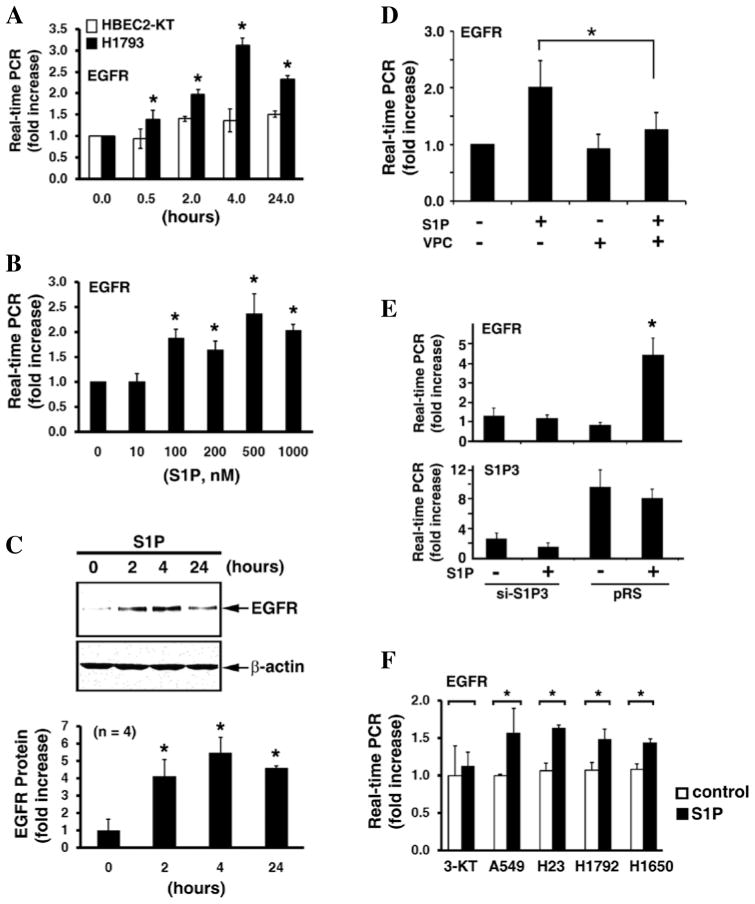
Sphingosine-1-phosphate (S1P) regulates a wide array of biological functions. However, the role of S1P signaling in tumorigenesis remains to be elucidated. In this study, we show that S1P receptor subtype 3 (S1P₃) is markedly up-regulated in a subset of lung adenocarcinoma cells compared to normal lung epithelial cells. Specific knockdown of S1P₃ receptors inhibits proliferation and anchorage-independent growth of lung adenocarcinoma cells. Mechanistically, we demonstrate that S1P₃ signaling increases epidermal growth factor receptor (EGFR) expression via the Rho kinase (ROCK) pathway in lung adenocarcinoma cells. Nuclear run-off analysis indicates that S1P/S1P₃ signaling transcriptionally increases EGFR expression. Knockdown of S1P₃ receptors diminishes the S1P-stimulated EGFR expression in lung adenocarcinoma cells. Moreover, S1P treatment greatly enhances EGF-stimulated colony formation, proliferation and invasion of lung adenocarcinoma cells. Together, these results suggest that the enhanced S1P₃-EGFR signaling axis may contribute to the tumorigenesis or progression of lung adenocarcinomas.
Figures

Similar articles
-
ETS-1-mediated transcriptional up-regulation of CD44 is required for sphingosine-1-phosphate receptor subtype 3-stimulated chemotaxis.J Biol Chem. 2013 Nov 8;288(45):32126-32137. doi: 10.1074/jbc.M113.495218. Epub 2013 Sep 24. J Biol Chem. 2013. PMID: 24064218 Free PMC article.
-
Cross-talk between LPA1 and epidermal growth factor receptors mediates up-regulation of sphingosine kinase 1 to promote gastric cancer cell motility and invasion.Cancer Res. 2008 Aug 15;68(16):6569-77. doi: 10.1158/0008-5472.CAN-08-0411. Cancer Res. 2008. PMID: 18701480 Free PMC article.
-
TGF-β/SMAD3 Pathway Stimulates Sphingosine-1 Phosphate Receptor 3 Expression: IMPLICATION OF SPHINGOSINE-1 PHOSPHATE RECEPTOR 3 IN LUNG ADENOCARCINOMA PROGRESSION.J Biol Chem. 2016 Dec 30;291(53):27343-27353. doi: 10.1074/jbc.M116.740084. Epub 2016 Nov 17. J Biol Chem. 2016. PMID: 27856637 Free PMC article.
-
Sphingosine-1-phosphate signaling in physiology and diseases.Biofactors. 2012 Sep-Oct;38(5):329-37. doi: 10.1002/biof.1030. Epub 2012 Jun 7. Biofactors. 2012. PMID: 22674845 Review.
-
Sphingosin 1-phosphate contributes in tumor progression.J Cancer Res Ther. 2013 Oct-Dec;9(4):556-63. doi: 10.4103/0973-1482.126446. J Cancer Res Ther. 2013. PMID: 24518696 Review.
Cited by
-
Roles of sphingosine-1-phosphate signaling in cancer.Cancer Cell Int. 2019 Nov 14;19:295. doi: 10.1186/s12935-019-1014-8. eCollection 2019. Cancer Cell Int. 2019. PMID: 31807117 Free PMC article. Review.
-
ETS-1-mediated transcriptional up-regulation of CD44 is required for sphingosine-1-phosphate receptor subtype 3-stimulated chemotaxis.J Biol Chem. 2013 Nov 8;288(45):32126-32137. doi: 10.1074/jbc.M113.495218. Epub 2013 Sep 24. J Biol Chem. 2013. PMID: 24064218 Free PMC article.
-
Development of a Custom Fluid Flow Chamber for Investigating the Effects of Shear Stress on Periodontal Ligament Cells.Cells. 2024 Oct 23;13(21):1751. doi: 10.3390/cells13211751. Cells. 2024. PMID: 39513858 Free PMC article.
-
Sphingosine-1-Phosphate Metabolic Pathway in Cancer: Implications for Therapeutic Targets.Int J Mol Sci. 2025 Jan 26;26(3):1056. doi: 10.3390/ijms26031056. Int J Mol Sci. 2025. PMID: 39940821 Free PMC article. Review.
-
Sphingosine-1-phosphate receptor-2 mediated NFκB activation contributes to tumor necrosis factor-α induced VCAM-1 and ICAM-1 expression in endothelial cells.Prostaglandins Other Lipid Mediat. 2013 Oct;106:62-71. doi: 10.1016/j.prostaglandins.2013.06.001. Epub 2013 Jun 11. Prostaglandins Other Lipid Mediat. 2013. PMID: 23770055 Free PMC article.
References
-
- Hla T, Lee MJ, Ancellin N, et al. Sphingosine-1-phosphate: extracellular mediator or intracellular second messenger? Biochem Pharmacol. 1999;58:201–207. - PubMed
-
- Igarashi Y, Yatomi Y. Sphingosine 1-phosphate is a blood constituent released from activated platelets, possibly playing a variety of physiological and pathophysiological roles. Acta Biochim Pol. 1998;45:299–309. - PubMed
-
- Moolenaar WH. Bioactive lysophospholipids and their G protein-coupled receptors. Exp Cell Res. 1999;253:230–238. - PubMed
-
- Spiegel S. Sphingosine 1-phosphate: a prototype of a new class of second messengers. J Leukoc Biol. 1999;65:341–344. - PubMed
-
- Lee MJ, Van Brocklyn JR, Thangada S, et al. Sphingosine-1-phosphate as a ligand for the G protein-coupled receptor EDG-1. Science. 1998;279:1552–1555. - PubMed
Publication types
MeSH terms
Substances
Grants and funding
LinkOut - more resources
Full Text Sources
Medical
Research Materials
Miscellaneous
