

Abdominal superficial subcutaneous fat: a putative distinct protective fat subdepot in type 2 diabetes
- PMID: 22344612
- PMCID: PMC3322677
- DOI: 10.2337/dc11-1583
Abdominal superficial subcutaneous fat: a putative distinct protective fat subdepot in type 2 diabetes
Abstract
Objective: Unlike visceral adipose tissue (VAT), the association between subcutaneous adipose tissue (SAT) and obesity-related morbidity is controversial. In patients with type 2 diabetes, we assessed whether this variability can be explained by a putative favorable, distinct association between abdominal superficial SAT (SSAT) (absolute amount or its proportion) and cardiometabolic parameters.
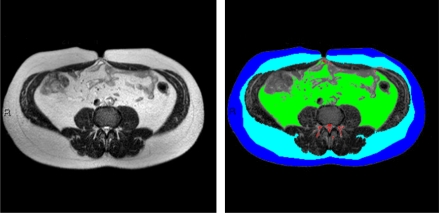
Research design and methods: We performed abdominal magnetic resonance imaging (MRI) in 73 patients with diabetes (mean age 58 years, 83% were men) and cross-sectionally analyzed fat distribution at S1-L5, L5-L4, and L3-L2 levels. Patients completed food frequency questionnaires, and subgroups had 24-h ambulatory blood pressure monitoring and 24-h ambulatory electrocardiography.
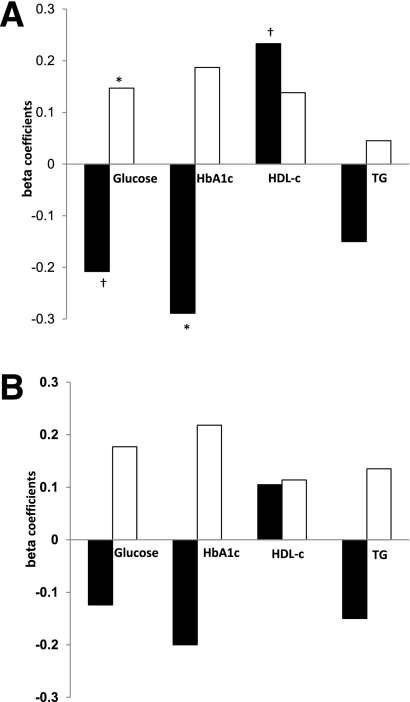
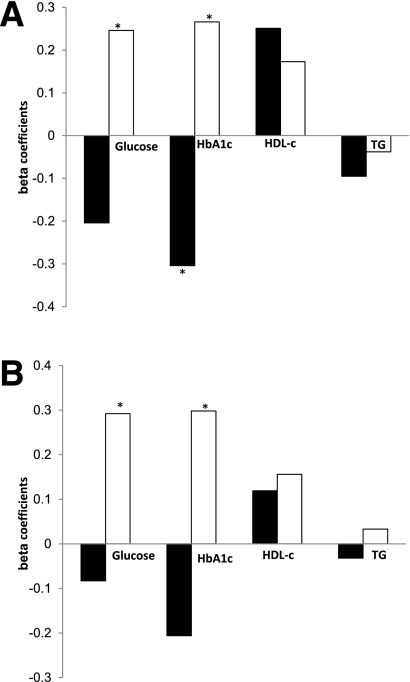
Results: Women had higher %SSAT (37 vs. 23% in men; P < 0.001) despite a similar mean waist circumference. Fasting plasma glucose (P = 0.046) and HbA(1c) (P = 0.006) were both lower with increased tertile of absolute SSAT. In regression models adjusted for age, waist circumference, and classes of medical treatments used in this patient population, increased %SSAT was significantly associated with decreased HbA(1c) (β = -0.317; P = 0.013), decreased daytime ambulatory blood pressure (β = -0.426; P = 0.008), and increased HDL cholesterol (β = 0.257; P = 0.042). In contrast, increased percent of deep SAT (DSAT) was associated with increased HbA(1c) (β = 0.266; P = 0.040) and poorer heart rate variability parameters (P = 0.030). Although total fat and energy intake were not correlated with fat tissue distribution, increased intake of trans fat tended to be associated with total SAT (r = 0.228; P = 0.05) and DSAT (r = 0.20; P = 0.093), but not with SSAT.
Conclusions: Abdominal SAT is composed of two subdepots that associate differently with cardiometabolic parameters. Higher absolute and relative distribution of fat in abdominal SSAT may signify beneficial cardiometabolic effects in patients with type 2 diabetes.
Figures
References
-
- Hamdy O, Porramatikul S, Al-Ozairi E. Metabolic obesity: the paradox between visceral and subcutaneous fat. Curr Diabetes Rev 2006;2:367–373 - PubMed
-
- Fox CS, Massaro JM, Hoffmann U, et al. Abdominal visceral and subcutaneous adipose tissue compartments: association with metabolic risk factors in the Framingham Heart Study. Circulation 2007;116:39–48 - PubMed
-
- Sniderman AD, Bhopal R, Prabhakaran D, Sarrafzadegan N, Tchernof A. Why might South Asians be so susceptible to central obesity and its atherogenic consequences? The adipose tissue overflow hypothesis. Int J Epidemiol 2007;36:220–225 - PubMed
-
- Deschênes D, Couture P, Dupont P, Tchernof A. Subdivision of the subcutaneous adipose tissue compartment and lipid-lipoprotein levels in women. Obes Res 2003;11:469–476 - PubMed
Publication types
MeSH terms
Substances
LinkOut - more resources
Full Text Sources
Medical
Research Materials
Miscellaneous
