. 2012 May;78(9):3234-41.
doi: 10.1128/AEM.00030-12. Epub 2012 Feb 17.

Emergence and stability of high-pressure resistance in different food-borne pathogens

Affiliations

Emergence and stability of high-pressure resistance in different food-borne pathogens

Dietrich Vanlint et al. Appl Environ Microbiol. 2012 May.

Abstract

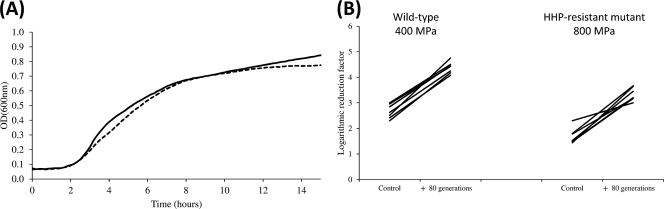
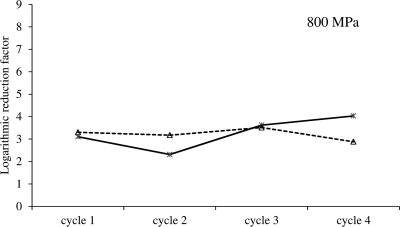
High hydrostatic pressure (HHP) processing is becoming a valuable nonthermal food pasteurization technique, although there is reasonable concern that bacterial HHP resistance could compromise the safety and stability of HHP-processed foods. While the degree of natural HHP resistance has already been shown to vary greatly among and within bacterial species, a still unresolved question remains as to what extent different food-borne pathogens can actually develop HHP resistance. In this study, we therefore examined and compared the intrinsic potentials for HHP resistance development among strains of Escherichia coli, Shigella flexneri, Salmonella enterica serovars Typhimurium and Enteritidis, Yersinia enterocolitica, Aeromonas hydrophila, Pseudomonas aeruginosa, and Listeria innocua using a selective enrichment approach. Interestingly, of all strains examined, the acquisition of extreme HHP resistance could be detected in only some of the E. coli strains, indicating that a specific genetic predisposition might be required for resistance development. Furthermore, once acquired, HHP resistance proved to be a very stable trait that was maintained for >80 generations in the absence of HHP exposure. Finally, at the mechanistic level, HHP resistance was not necessarily linked to derepression of the heat shock genes and was not related to the phenomenon of persistence.


Figures

Fig 1
Fig 1
Selective enrichment of different food-borne pathogens toward HHP resistance (at 20°C). For each strain, four independent axenic cultures were iteratively exposed to progressively intensifying pressure shocks (15 min; 20°C), with intermittent resuscitation and growth of the survivors. Line graphs (-♢-) present the inactivation during the stepwise selection regimen with 10- or 25-MPa increments and are expressed as the logarithmic reduction factor [i.e., log(N0/N)]. At the end of the selection regimen, the most HHP-resistant clone that had enriched in the corresponding cultures was isolated, and its acquired HHP resistance (black bars) was determined and compared to that of the original parent strain (white bars). Results shown in the bars are expressed as mean values ± standard deviations of three independent replicates. ND as well as the abrupt end of a line graph at pressures below 800 MPa indicate that the corresponding N fell below the detection limit, which was 10 or 200 CFU/ml for results shown in bars or line graphs, respectively.
Fig 2
Fig 2
Selective enrichment of different E. coli strains toward HHP resistance (at 20°C). For each strain, four independent axenic cultures were iteratively exposed to progressively intensifying pressure shocks (15 min; 20°C), with intermittent resuscitation and growth of the survivors. Line graphs (-♢-) present the inactivation during the stepwise selection regimen with 25-MPa increments and are expressed as the logarithmic reduction factor [i.e., log(N0/N)]. At the end of the selection regimen, the most HHP-resistant clone that had enriched in the corresponding cultures was isolated and its acquired HHP resistance (black bars) was determined and compared to that of the original parent strain (white bars). Results shown in the bars are expressed as mean values ± standard deviations of three independent replicates. ND as well as the abrupt end of a line graph at pressures below 800 MPa indicate that the corresponding N fell below the detection limit, which was 10 or 200 CFU/ml for results shown in bars or line graphs, respectively.
Fig 3
Fig 3
(A) Growth curves of E. coli MG1655 (straight line) and its corresponding HHP-resistant mutant (dotted line) (i.e., DVL20), monitored as OD600 in LB growth medium at 37°C. Growth curves were averaged across three replicate cultures. Standard variations were below <8.5% and were not included. (B) Change in logarithmic reduction factor of seven independent axenic cultures of both E. coli MG1655 (treated at 400 MPa, 15 min, 20°C) and its HHP-resistant mutant (DVL20; treated at 800 MPa, 15 min, 20°C) after growth to stationary phase for 24 h (i.e., control) or for an additional ca. 80 generations (i.e., + 80 generations) in the absence of HHP exposure. Please note that lines are used to connect data points from the same lineage.
Fig 4
Fig 4
Selective enrichment of two independent cultures of E. coli DVL20 toward increased HHP resistance at 800 MPa (20°C). The two axenic cultures were iteratively exposed to HHP shocks of 800 MPa (15 min, 20°C), with intermittent resuscitation and growth. Line graphs (----△---- and formula image
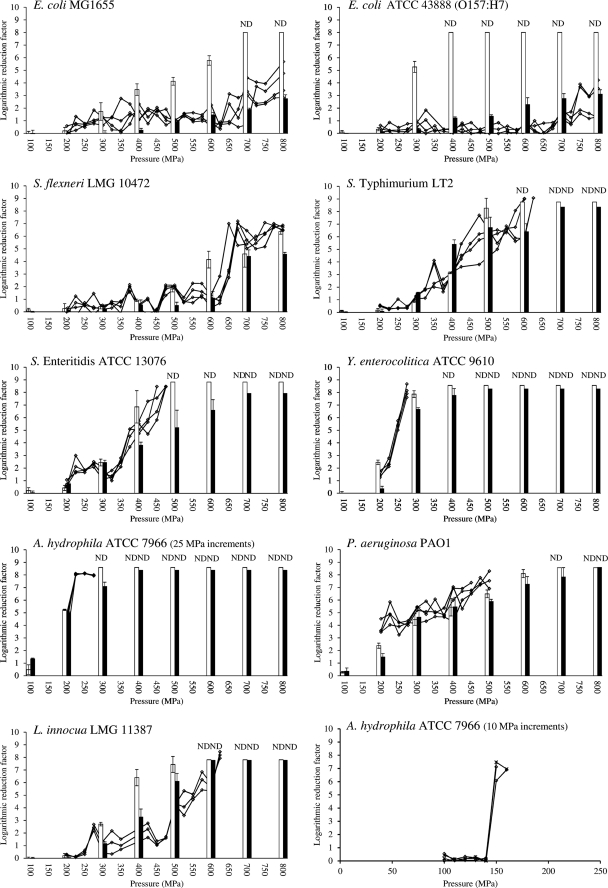
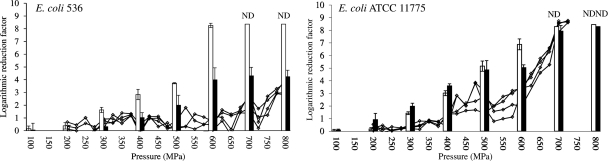
) present the inactivation after each HHP shock and are expressed as log(N0/N).
Fig 5
Fig 5
(A) Logarithmic reduction factor [i.e., log(N0/N)] of E. coli MG21 (□) and its hipA7 derivative (i.e., MG1655A7; with increased persister fraction) (■) after HHP treatment at the indicated pressures (15 min, 20°C). ND indicates that the corresponding N fell below the detection limit of 10 CFU/ml. (B) Difference in amount of persister cells among indicated wild-type and derived mutant strains of E. coli, expressed as log(Nmutant/Nwild-type) in which Nmutant and Nwild-type represent the persister fraction (in CFU/ml) of the corresponding populations. Please note that the MG1655 hipA7 mutant (i.e., MG1655A7) was included as a positive control. All data shown are averages ± standard deviations from an experiment with three independent cultures of each strain.

References

    1. Aertsen A, et al. 2004. Heat shock protein-mediated resistance to high hydrostatic pressure in Escherichia coli. Appl. Environ. Microbiol. 70:2660–2666 - PMC - PubMed
    1. Alpas H, et al. 1999. Variation in resistance to hydrostatic pressure among strains of foodborne pathogens. Appl. Environ. Microbiol. 65:4248–4251 - PMC - PubMed
    1. Ashida H, et al. 2011. Shigella are versatile mucosal pathogens that circumvent the host innate immune system. Curr. Opin. Immunol. 23:448–455 - PubMed
    1. Benito A, Ventoura G, Casadei M, Robinson T, Mackey B. 1999. Variation in resistance of natural isolates of Escherichia coli O157 to high hydrostatic pressure, mild heat, and other stresses. Appl. Environ. Microbiol. 65:1564–1569 - PMC - PubMed
    1. Considine K, Kelly A, Fitzgerald G, Hill C, Sleator R. 2008. High-pressure processing-effects on microbial food safety and food quality. FEMS Microbiol. Lett. 281:1–9 - PubMed

Publication types

LinkOut - more resources