

Correcting for spectral cross-talk in dual-color fluorescence cross-correlation spectroscopy
- PMID: 22344749
- PMCID: PMC3495304
- DOI: 10.1002/cphc.201100801
Correcting for spectral cross-talk in dual-color fluorescence cross-correlation spectroscopy
Abstract
Dual-color fluorescence cross-correlation spectroscopy (dcFCCS) allows one to quantitatively assess the interactions of mobile molecules labeled with distinct fluorophores. The technique is widely applied to both reconstituted and live-cell biological systems. A major drawback of dcFCCS is the risk of an artifactual false-positive or overestimated cross-correlation amplitude arising from spectral cross-talk. Cross-talk can be reduced or prevented by fast alternating excitation, but the technology is not easily implemented in standard commercial setups. An experimental strategy is devised that does not require specialized hardware and software for recognizing and correcting for cross-talk in standard dcFCCS. The dependence of the cross-talk on particle concentrations and brightnesses is quantitatively confirmed. Moreover, it is straightforward to quantitatively correct for cross-talk using quickly accessible parameters, that is, the measured (apparent) fluorescence count rates and correlation amplitudes. Only the bleed-through ratio needs to be determined in a calibration measurement. Finally, the limitations of cross-talk correction and its influence on experimental error are explored.
Copyright © 2012 WILEY-VCH Verlag GmbH & Co. KGaA, Weinheim.
Figures
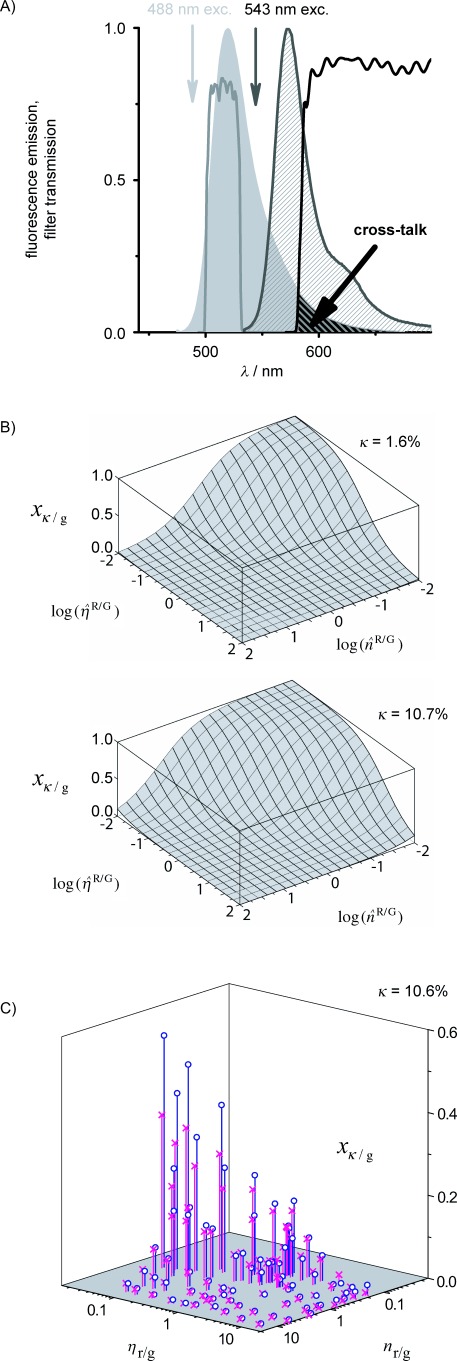
 is depicted as a function of the brightness ratio
  and number ratio
  of the red and green species according to Equation (34c). The upper plot was calculated for a very small bleed-through ratio (κ=1.6 %, Alexa 488 and Cy5), the lower plot for a larger bleed-through ratio (κ=10.7 %, Alexa 488 and Alexa 546). C) Attempt to approximate the artifactual relative cross-correlation
  by substituting apparent brightnesses and numbers (
  ,
,  ) for true brightnesses and numbers (
  ,
,  ) in Equation (34c). The circles show the measured artifactual relative cross-correlations, the crosses the predictions of the cross-talk artifact. A rather large discrepancy between prediction and measurement is obtained. Equating true and apparent parameter values should hence be avoided.
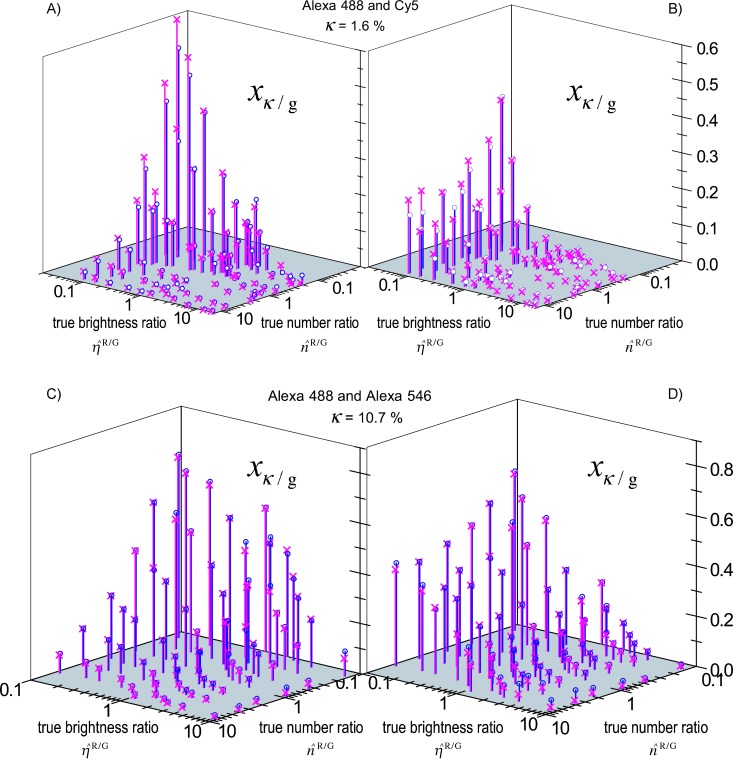
 and
and  ). To determine these, separate measurements were performed in which the 488 nm laser was switched off. The prediction using the bleed-through ratio κcal=1.6 % from the calibration measurement is mostly successful. At low red brightnesses, however, the artifactual cross-correlation is overestimated. The reason for this discrepancy is that the red brightness is underestimated from the separate measurements, in which the 488 nm laser does not contribute to the excitation of the red dye (Cy5), whereas it does so in the actual cross-correlation measurement. C, D) Relative cross-correlations as a function of real brightness and number ratios (
  and
and  ) for a dye and filter combination with larger spectral cross-talk (Alexa 488, Alexa 546; κcal=10.7 %).
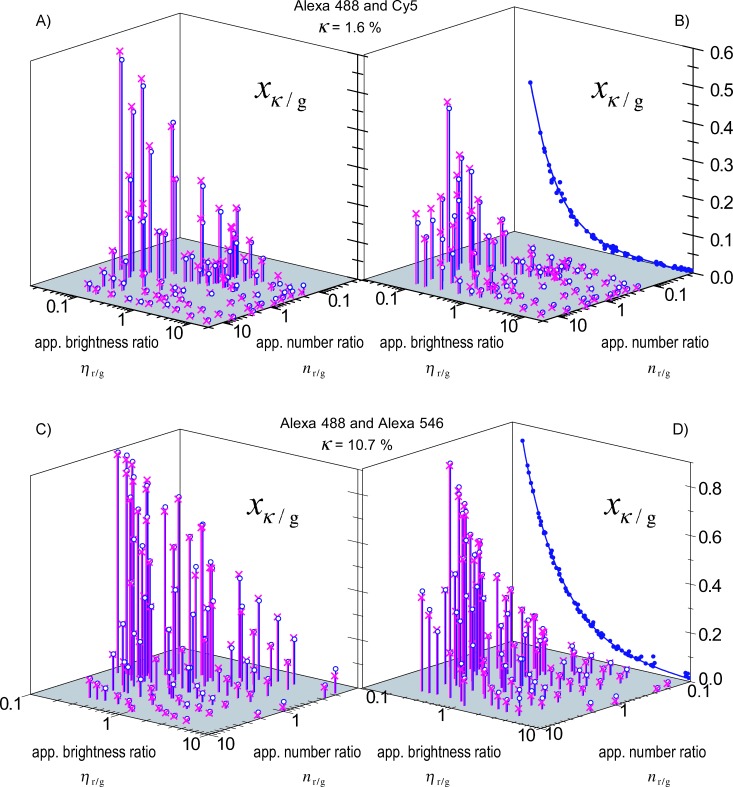
 , determined directly from the count rates and amplitudes obtained in the cross-correlation experiment. The calculation (predicted values, crosses) provides a reliable estimate of the artifactual relative cross-correlation (open circles). The projection of the experimental values in (B) fits a hyperbolic function, which confirms that xκ/r is independent of
  [Eq. (35b)]. The hyperbolic fit also allows an independent determination of the bleed-through ratio κ, yielding κ=1.5 %, which is close to the value of κcal=1.6 % that was determined in the initial calibration [Eq. (3)] and was used for the cross-talk prediction. C, D) Relative cross-correlations as a function of apparent brightness and number ratios (
  and
and  ) for a dye and filter combination with larger bleed-through (Alexa 488, Alexa 546; κcal=10.7 %). The calculation provides very good estimates for the expected artifactual relative cross-correlation. Projection: from fitting Equation (13a), a bleed-through ratio of κ=10.8 % is recovered, which is close to the value of 10.7 % obtained by the simple calibration.
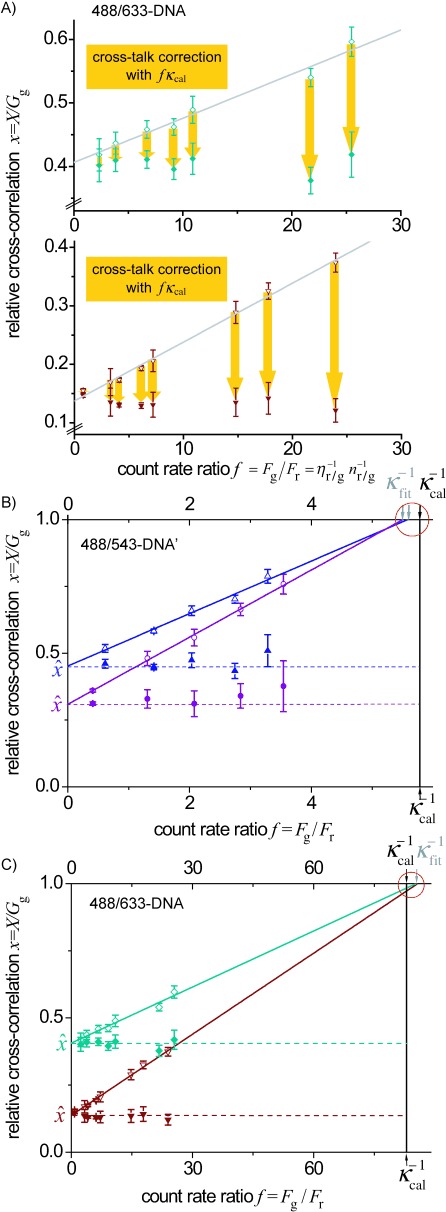
 , by finding the intersection with the ordinate axis (Eq. (4); indicated by the dashed lines). In addition, the intersections with the x=1 line yield κfit−1 which is in reasonable agreement with κcal−1. The value κcal from the initial calibration is slightly smaller than the bleed-through values obtained by fitting the data sets, κfit, which is why the cross-correlation values corrected using κcal lie above the dashed lines. Errors increase with increasing κf. C) The data from (A) were plotted on a different scale, which allows the comparison of the values of κfit from the data sets with κcal from the initial calibration. They are in reasonably good agreement. For the 488/633 configuration, dcFCCS measurements tend to be limited by the usable range of count-rate ratios f. Errors remain rather small because of the small bleed-through ratio κ.
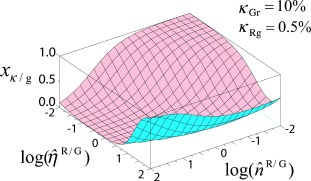
 using Equation (37a). The bleed-through of the Green dye into the red channel κGr in this example is 10 %. In contrast to Figure 1 B, this example assumes that there is a significant amount of “reverse” bleed-through from the Red dye into the green channel (κRg=0.5 %). With bidirectional bleed-through, the resulting cross-talk artifact becomes large not only when the green particles are in excess and brighter compared to the red, but also in the other extreme, when the red particles are in excess and brighter than the green particles. A relevant “reverse” bleed-through like in this simulation was not encountered in the experiments with Alexa 488/Alexa 546 and Alexa 488/Cy5 (Figure 2).
References
Publication types
MeSH terms
Substances
LinkOut - more resources
Full Text Sources
Other Literature Sources
