. 2013 Feb;23(2):255-63.
doi: 10.1093/cercor/bhs001. Epub 2012 Feb 17.

Calibrating BOLD fMRI activations with neurovascular and anatomical constraints

Affiliations

Calibrating BOLD fMRI activations with neurovascular and anatomical constraints

Xin Di et al. Cereb Cortex. 2013 Feb.

Abstract

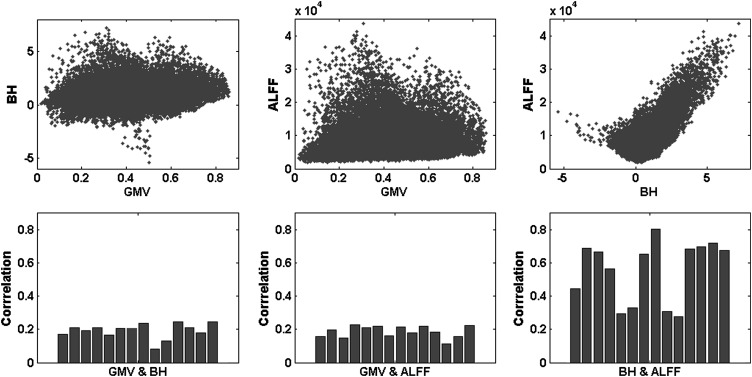
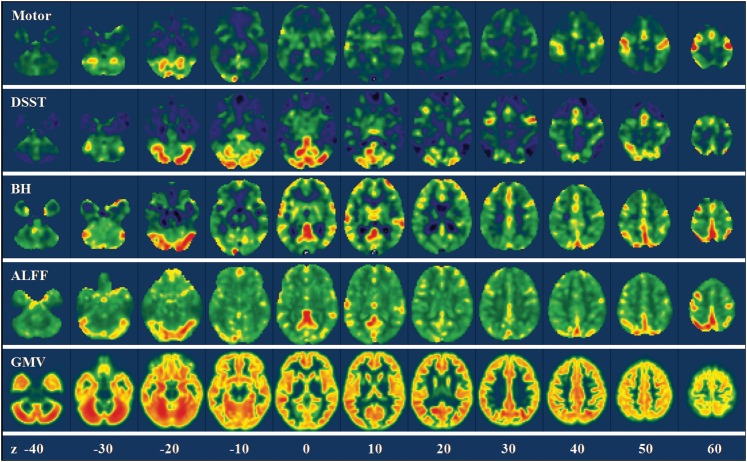
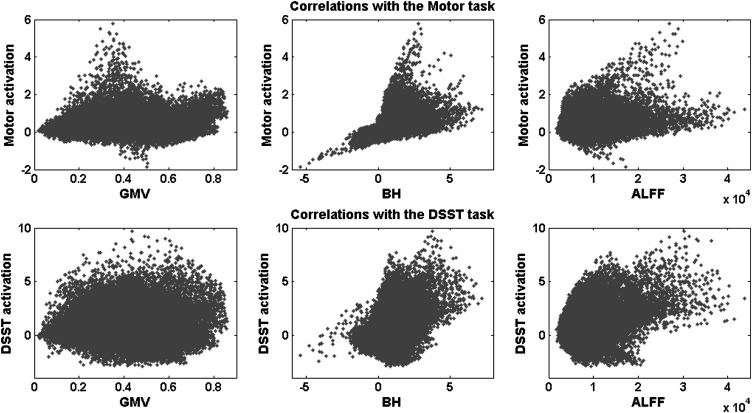
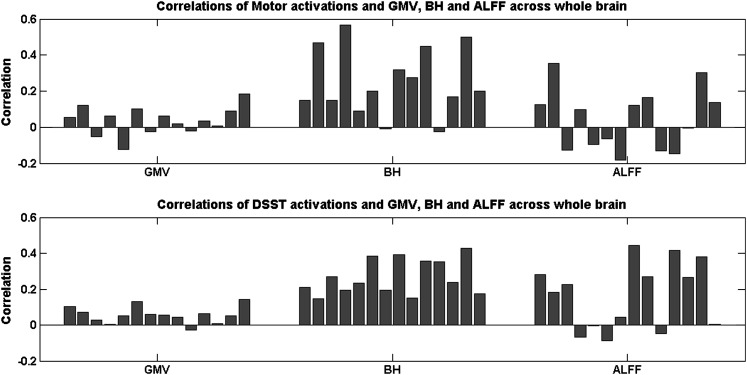
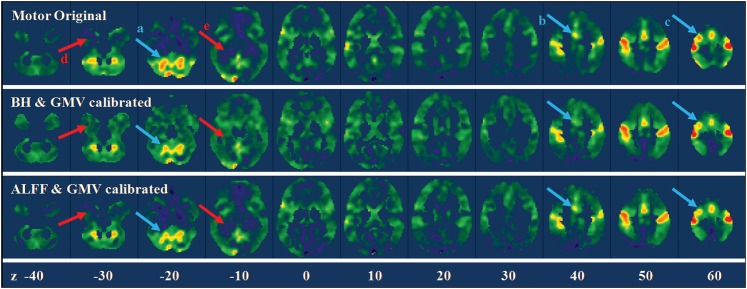
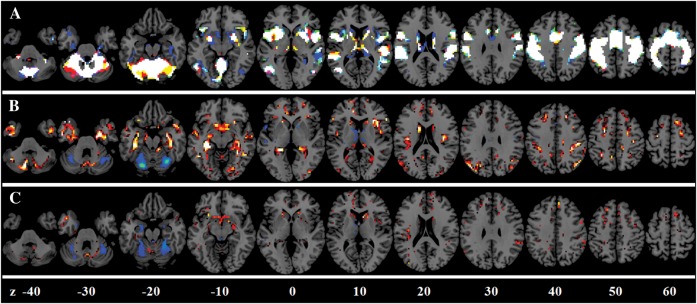
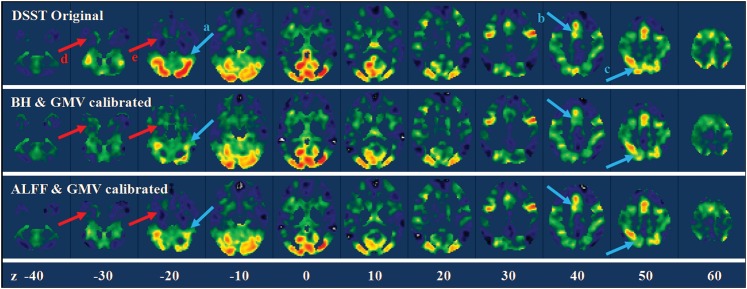
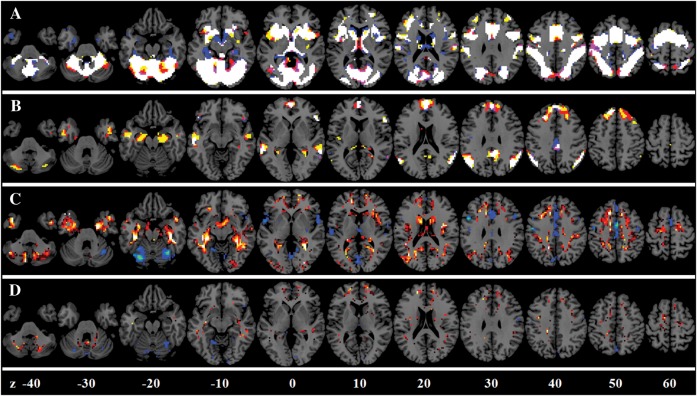
Functional magnetic resonance imaging signals, in addition to reflecting neuronal response, also contain physiological variances. These factors may introduce variability into blood oxygen level-dependent (BOLD) activation results, particularly in different population groups. In this study, we hypothesized that the amplitude as well as the spatial extent of BOLD activation could be improved after minimizing the variance caused by the neurovascular and anatomical factors. Subjects were scanned while they performed finger tapping and digit-symbol substitution tasks (DSSTs). Partial volume and neurovascular effects were estimated on a voxelwise basis using subjects' own gray matter volume (GMV), breath holding (BH), and amplitude of low-frequency fluctuation (ALFF). The results showed that all individual's GMV, BH, and ALFF could significantly predict motor and DSST activations in a voxelwise manner. Whole-brain analyses were conducted to regress out the anatomical and neurovascular information. Differential maps (obtained using t-test) indicated that the adjustment tended to suppress activation in regions that were near vessels such as midline cingulate gyrus, bilateral anterior insula, and posterior cerebellum. These results suggest that voxelwise adjustment using GMV and neurovascular parameters can minimize structural and physiological variances among individuals and be used for quantitative comparisons.


Figures

Figure 1.
Figure 1.
Correlations among the GMV, BH activations (contrast values), and ALFF across the whole brain. The upper panels illustrated the scatterplot for a single subject, and the lower panels showed the correlation coefficient for each subject.
Figure 2.
Figure 2.
Voxelwise variances of the motor activations, the DSST activations, the GMV, the BH activations, and the ALFF across the whole brain in a representative subject. The color coding was adjusted to show the full range of the variance for each map. Z values in the bottom represented the z coordinates in the MNI space.
Figure 3.
Figure 3.
Scatterplot of the relationship between the task activations (beta values) and the GMV (left), the BH activations (beta values, middle), and the ALFF (right) for a single subject across the whole brain. The upper panels showed the motor task activations, and the lower panels showed the DSST activations.
Figure 4.
Figure 4.
Correlation coefficients between the task activations and the GMV (left), the BH activations (middle), and the ALFF (right) across the whole brain for each subject. The upper panels showed the motor task activations, and the lower panels showed the DSST activations.
Figure 5.
Figure 5.
Mean AIC for the 3 regression models for the motor task (A and B) and DSST (C and D). The left panels (A and C) show the AIC for the GMV and BH calibration, and the right panels (B and D) show the AIC for the GMV and ALFF calibration.
Figure 6.
Figure 6.
Whole-brain motor task activation maps for a single subject before and after calibrations. The upper panel showed the original beta maps of the motor activations, and the middle and lower panels showed the beta maps after BH/GMV and ALFF/GMV calibrations. The arrows highlighted the regions with obvious suppression (light blue) and enhancement (light red) after calibrations. Z values in the bottom represented the z coordinates in the MNI space.
Figure 7.
Figure 7.
BOLD activation calibration for the motor task. (A) Overlap among the original activations (in red), the activations after GMV/BH adjustment (in blue), and the activations after the GMV/ALFF adjustment (in green). (B) Enhanced activations (in red) and suppressed activations (in blue) after the GMV/BH adjustment. (C) Enhanced activations (in red) and suppressed activations (in blue) after the GMV/ALFF adjustment. Z values represented the z coordinates in the MNI space.
Figure 8.
Figure 8.
Whole-brain DSST activation maps for a single subject before and after calibrations. The upper panel showed the original beta maps of the DSST activations, and the middle and lower panels showed the beta maps after BH/GMV and ALFF/GMV calibrations. The arrows highlighted the regions with obvious suppression (light blue) and enhancement (light red) after calibrations. Z values in the bottom represented the z coordinates in the MNI space.
Figure 9.
Figure 9.
BOLD activation calibration for the DSST. (A) Overlap among the original positive activations (in red), the activations after GMV/BH adjustment (in blue), and the activations after the GMV/ALFF adjustment (in green). (B) Overlap among the original negative activations (in red), the activations after GMV/BH adjustment (in blue), and the activations after the GMV/ALFF adjustment (in green). Note that the activation maps were two-tailed, thus reflected both activations and deactivations. (C) Enhanced activations (in red) and suppressed activations (in blue) after the GMV/BH adjustment. (D) Enhanced activations (in red) and suppressed activations (in blue) after the GMV/ALFF adjustment. Z values represented the z coordinates in the MNI space.

References

    1. Akaike H. A new look at statistical-model identification. IEEE Trans Automat Contr. 1974;19:716–723.
    1. Ashburner J, Friston KJ. Unified segmentation. Neuroimage. 2005;26(3):839–851. - PubMed
    1. Bandettini PA, Wong EC. A hypercapnia-based normalization method for improved spatial localization of human brain activation with fMRI. NMR Biomed. 1997;10(4–5):197–203. - PubMed
    1. Birn RM, Diamond JB, Smith MA, Bandettini PA. Separating respiratory-variation-related fluctuations from neuronal-activity-related fluctuations in fMRI. Neuroimage. 2006;31(4):1536–1548. - PubMed
    1. Biswal BB, Kannurpatti SS, Rypma B. Hemodynamic scaling of fMRI-BOLD signal: validation of low-frequency spectral amplitude as a scalability factor. Magn Reson Imaging. 2007;25(10):1358–1369. - PMC - PubMed

Publication types