

Loss tangent and complex modulus estimated by acoustic radiation force creep and shear wave dispersion
- PMID: 22345425
- PMCID: PMC3376913
- DOI: 10.1088/0031-9155/57/5/1263
Loss tangent and complex modulus estimated by acoustic radiation force creep and shear wave dispersion
Abstract
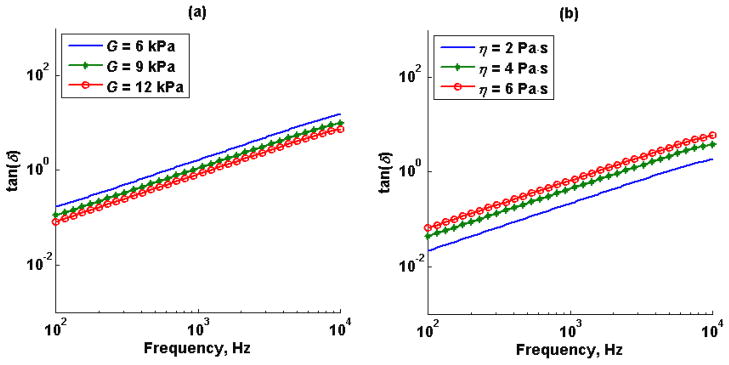
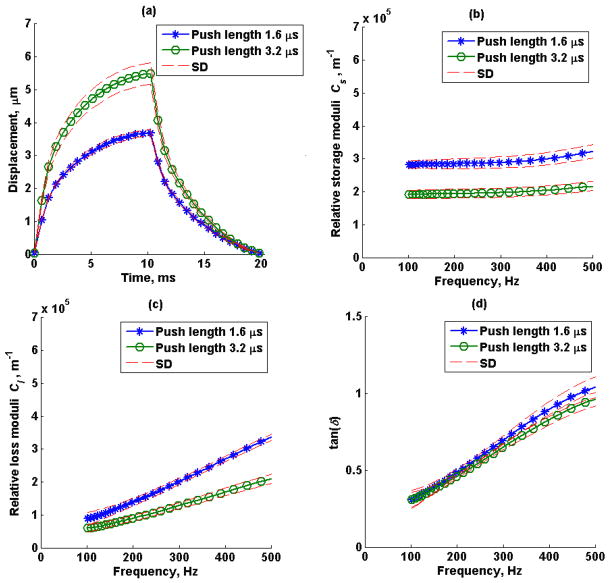
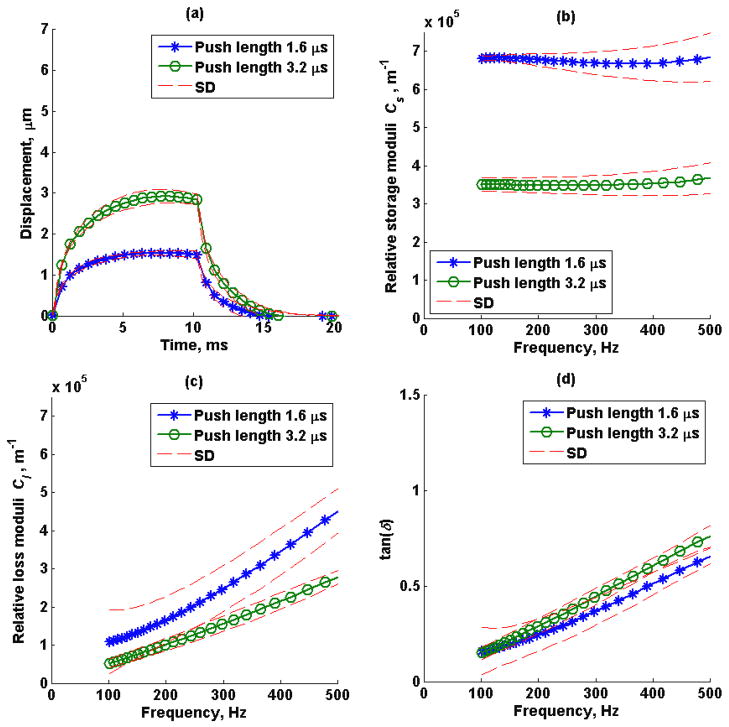
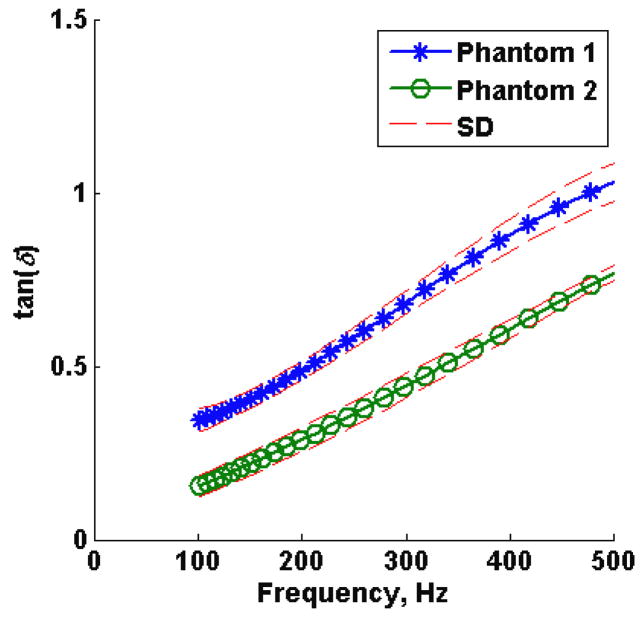
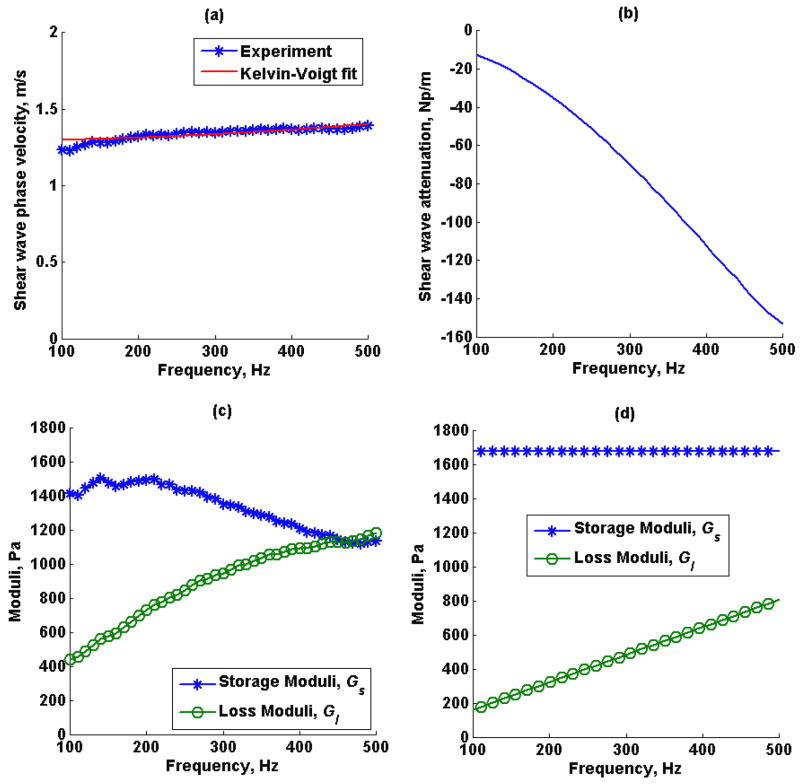
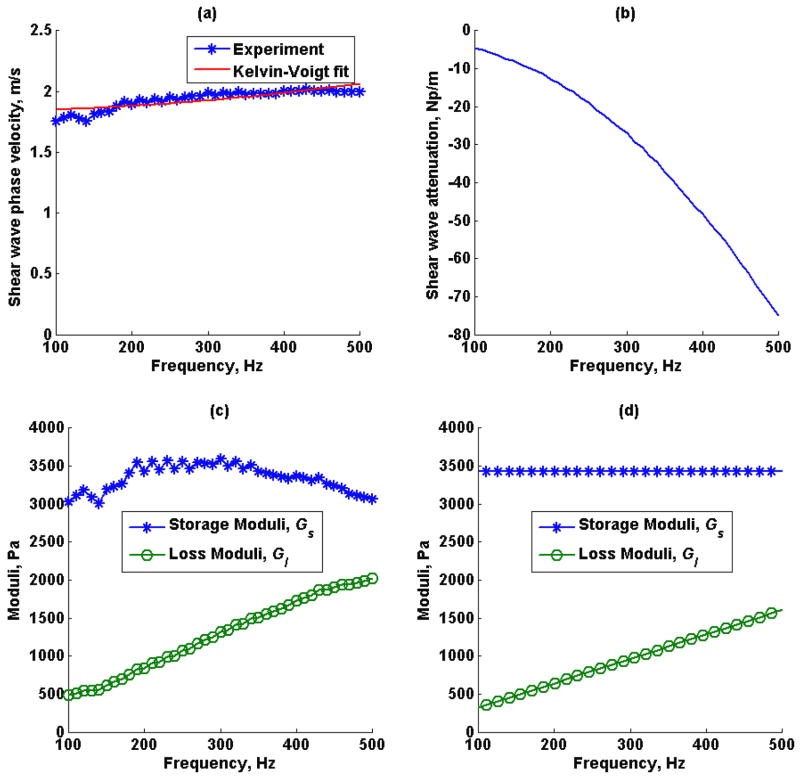
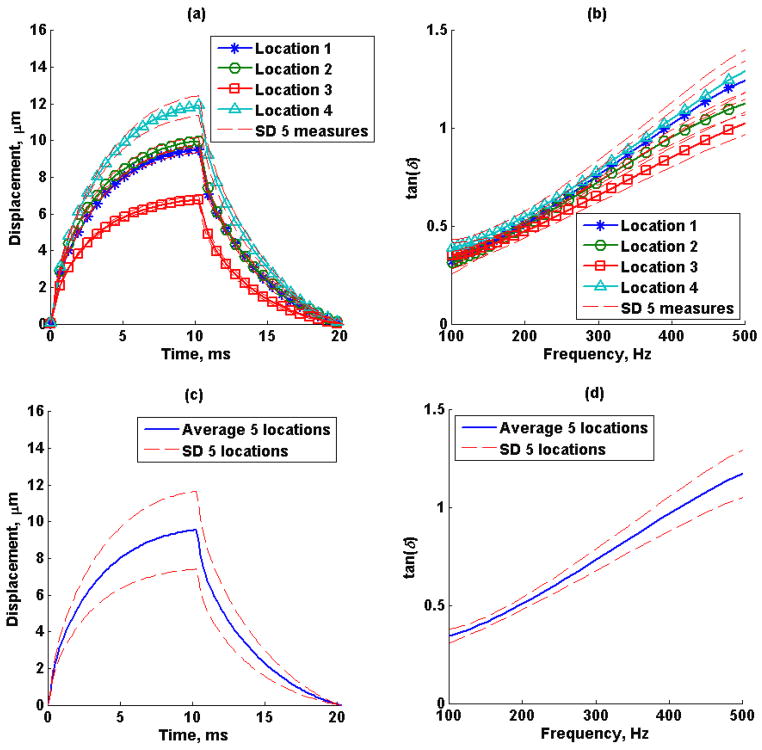
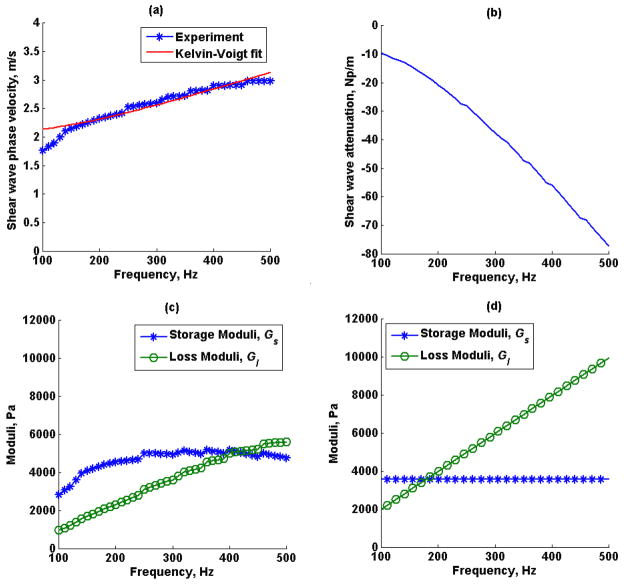
Elasticity imaging methods have been used to study tissue mechanical properties and have demonstrated that tissue elasticity changes with disease state. In current shear wave elasticity imaging methods typically only shear wave speed is measured and rheological models, e.g. Kelvin-Voigt, Maxwell and Standard Linear Solid, are used to solve for tissue mechanical properties such as the shear viscoelastic complex modulus. This paper presents a method to quantify viscoelastic material properties in a model-independent way by estimating the complex shear elastic modulus over a wide frequency range using time-dependent creep response induced by acoustic radiation force. This radiation force induced creep method uses a conversion formula that is the analytic solution of a constitutive equation. The proposed method in combination with shearwave dispersion ultrasound vibrometry is used to measure the complex modulus so that knowledge of the applied radiation force magnitude is not necessary. The conversion formula is shown to be sensitive to sampling frequency and the first reliable measure in time according to numerical simulations using the Kelvin-Voigt model creep strain and compliance. Representative model-free shear complex moduli from homogeneous tissue mimicking phantoms and one excised swine kidney were obtained. This work proposes a novel model-free ultrasound-based elasticity method that does not require a rheological model with associated fitting requirements.
Figures
Similar articles
-
Acoustic Radiation Force-Induced Creep-Recovery (ARFICR): A Noninvasive Method to Characterize Tissue Viscoelasticity.IEEE Trans Ultrason Ferroelectr Freq Control. 2018 Jan;65(1):3-13. doi: 10.1109/TUFFC.2017.2768184. IEEE Trans Ultrason Ferroelectr Freq Control. 2018. PMID: 29283342 Free PMC article.
-
Acoustic radiation force-induced longitudinal shear wave for ultrasound-based viscoelastic evaluation.Ultrasonics. 2024 Aug;142:107389. doi: 10.1016/j.ultras.2024.107389. Epub 2024 Jun 22. Ultrasonics. 2024. PMID: 38924960 Free PMC article.
-
Shear elastic modulus estimation from indentation and SDUV on gelatin phantoms.IEEE Trans Biomed Eng. 2011 Jun;58(6):1706-14. doi: 10.1109/TBME.2011.2111419. Epub 2011 Feb 10. IEEE Trans Biomed Eng. 2011. PMID: 21317078 Free PMC article.
-
Tissue elasticity properties as biomarkers for prostate cancer.Cancer Biomark. 2008;4(4-5):213-25. doi: 10.3233/cbm-2008-44-505. Cancer Biomark. 2008. PMID: 18957712 Free PMC article. Review.
-
Mechanical properties of human hepatic tissues to develop liver-mimicking phantoms for medical applications.Biomech Model Mechanobiol. 2024 Apr;23(2):373-396. doi: 10.1007/s10237-023-01785-4. Epub 2023 Dec 10. Biomech Model Mechanobiol. 2024. PMID: 38072897 Free PMC article. Review.
Cited by
-
Viscoelastic Response Ultrasound Derived Relative Elasticity and Relative Viscosity Reflect True Elasticity and Viscosity: In Silico and Experimental Demonstration.IEEE Trans Ultrason Ferroelectr Freq Control. 2020 Jun;67(6):1102-1117. doi: 10.1109/TUFFC.2019.2962789. Epub 2019 Dec 30. IEEE Trans Ultrason Ferroelectr Freq Control. 2020. PMID: 31899421 Free PMC article.
-
Three-Dimensional Shear Wave Elastography Using a 2D Row Column Addressing (RCA) Array.BME Front. 2022 Jul 4;2022:9879632. doi: 10.34133/2022/9879632. eCollection 2022. BME Front. 2022. PMID: 37850186 Free PMC article.
-
Measurement of viscoelastic properties of in vivo swine myocardium using lamb wave dispersion ultrasound vibrometry (LDUV).IEEE Trans Med Imaging. 2013 Feb;32(2):247-61. doi: 10.1109/TMI.2012.2222656. Epub 2012 Oct 4. IEEE Trans Med Imaging. 2013. PMID: 23060325 Free PMC article.
-
Acoustic Radiation Force-Induced Creep-Recovery (ARFICR): A Noninvasive Method to Characterize Tissue Viscoelasticity.IEEE Trans Ultrason Ferroelectr Freq Control. 2018 Jan;65(1):3-13. doi: 10.1109/TUFFC.2017.2768184. IEEE Trans Ultrason Ferroelectr Freq Control. 2018. PMID: 29283342 Free PMC article.
-
Production of acoustic radiation force using ultrasound: methods and applications.Expert Rev Med Devices. 2018 Nov;15(11):819-834. doi: 10.1080/17434440.2018.1538782. Epub 2018 Oct 31. Expert Rev Med Devices. 2018. PMID: 30350736 Free PMC article. Review.
References
-
- Alleyne D. A two-dimensional Fourier transform method for the measurement of propagating multimode signals. J Acoust Soc Am. 1991:89.
-
- Arndt R, Schmidt S, Loddenkemper C, Grunbaum M, Zidek W, van der Giet M, Westhoff TH. Noninvasive evaluation of renal allograft fibrosis by transient elastography - a pilot study. Transpl Int. 2010;23:871–7. - PubMed
-
- Bercoff J, Tanter M, Fink M. Supersonic shear imaging: a new technique for soft tissue elasticity mapping. IEEE Trans Ultrason Ferroelectr Freq Control. 2004;51:396–409. - PubMed
Publication types
MeSH terms
Grants and funding
LinkOut - more resources
Full Text Sources
Other Literature Sources