. 2012 Feb;24(2):482-506.
doi: 10.1105/tpc.111.090894. Epub 2012 Feb 17.

JUNGBRUNNEN1, a reactive oxygen species-responsive NAC transcription factor, regulates longevity in Arabidopsis

Affiliations

JUNGBRUNNEN1, a reactive oxygen species-responsive NAC transcription factor, regulates longevity in Arabidopsis

Anhui Wu et al. Plant Cell. 2012 Feb.

Abstract

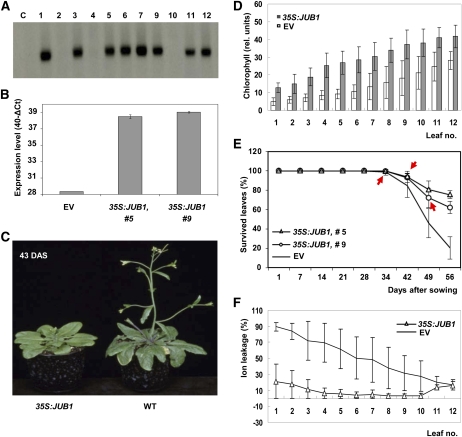
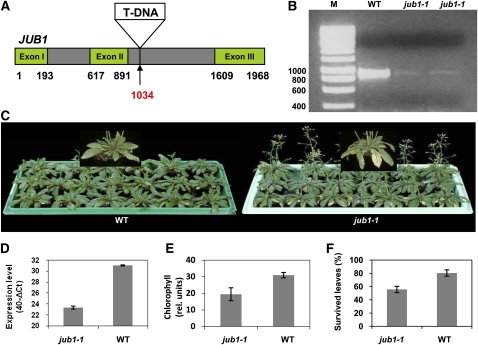
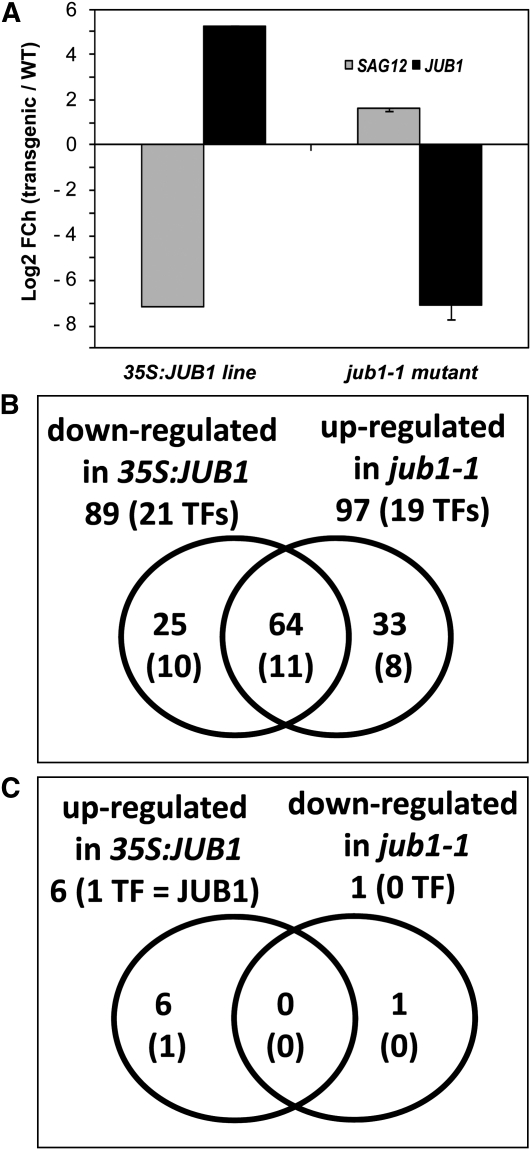
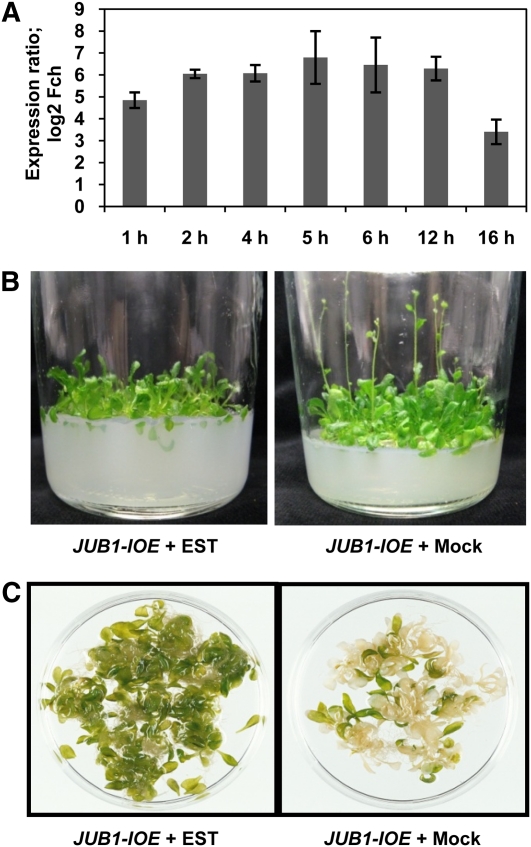
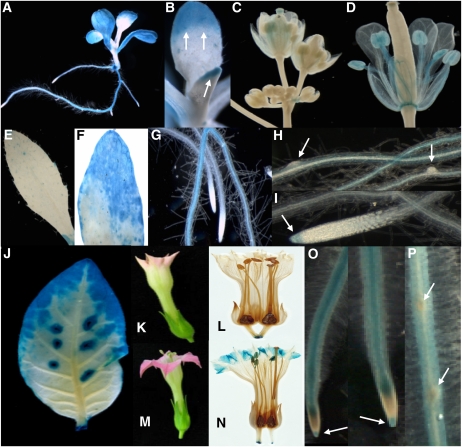
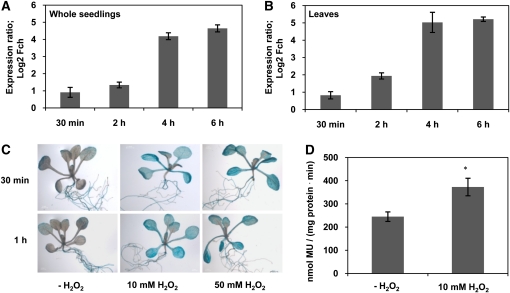
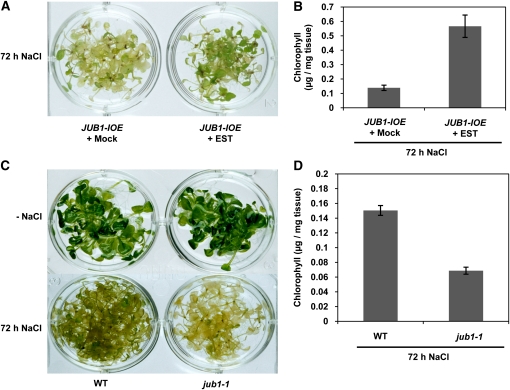
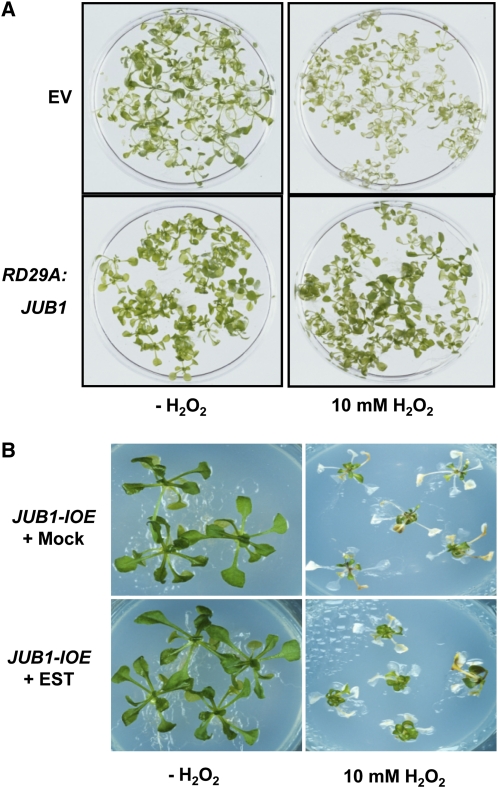
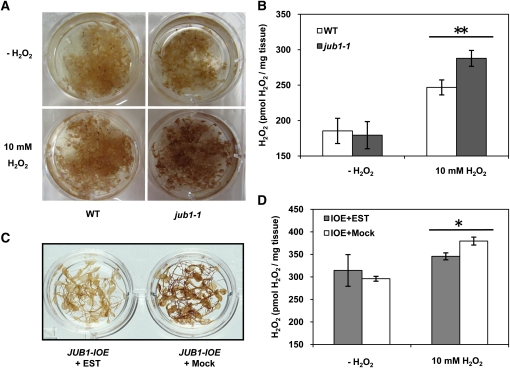
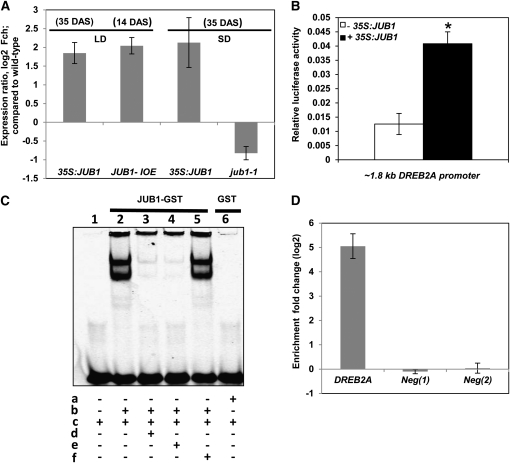
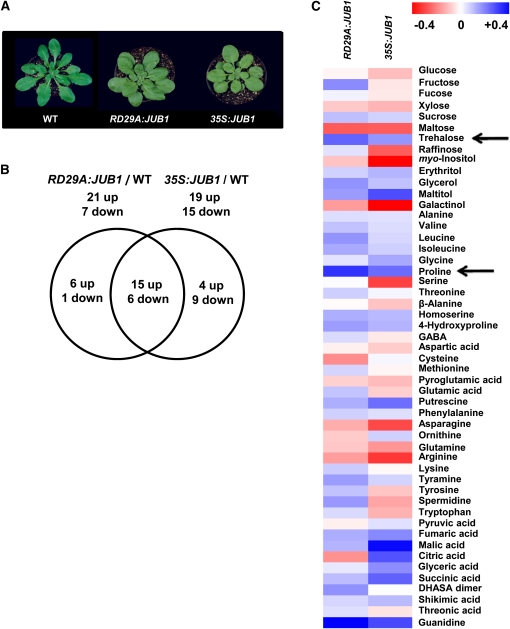
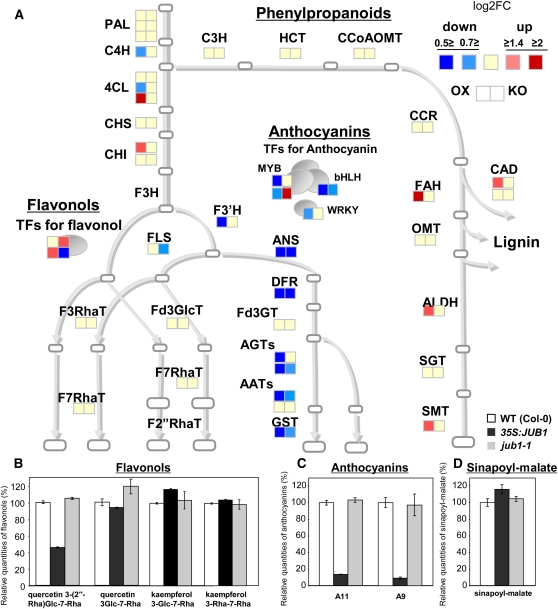
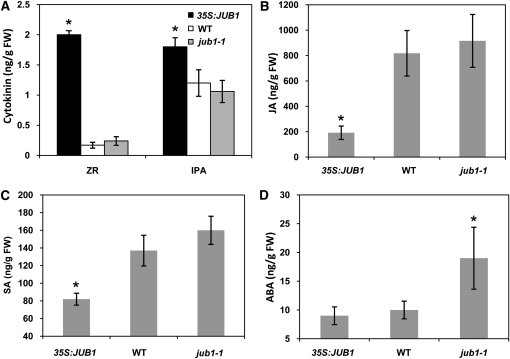
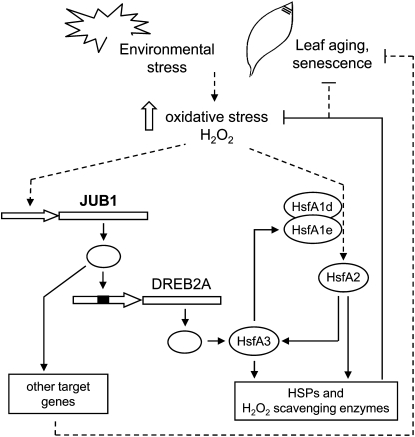
The transition from juvenility through maturation to senescence is a complex process that involves the regulation of longevity. Here, we identify JUNGBRUNNEN1 (JUB1), a hydrogen peroxide (H(2)O(2))-induced NAC transcription factor, as a central longevity regulator in Arabidopsis thaliana. JUB1 overexpression strongly delays senescence, dampens intracellular H(2)O(2) levels, and enhances tolerance to various abiotic stresses, whereas in jub1-1 knockdown plants, precocious senescence and lowered abiotic stress tolerance are observed. A JUB1 binding site containing a RRYGCCGT core sequence is present in the promoter of DREB2A, which plays an important role in abiotic stress responses. JUB1 transactivates DREB2A expression in mesophyll cell protoplasts and transgenic plants and binds directly to the DREB2A promoter. Transcriptome profiling of JUB1 overexpressors revealed elevated expression of several reactive oxygen species-responsive genes, including heat shock protein and glutathione S-transferase genes, whose expression is further induced by H(2)O(2) treatment. Metabolite profiling identified elevated Pro and trehalose levels in JUB1 overexpressors, in accordance with their enhanced abiotic stress tolerance. We suggest that JUB1 constitutes a central regulator of a finely tuned control system that modulates cellular H(2)O(2) level and primes the plants for upcoming stress through a gene regulatory network that involves DREB2A.


Figures

Figure 1.
Figure 1.
Physiological and Molecular Characterization of JUB1 Overexpression Plants. (A) RNA gel blot analysis of plants transformed with the 35S:JUB1 construct. Radiolabeled JUB1 cDNA was used as hybridization probe. Numbers indicate individual transformants; C, nontransformed wild-type (Col-0) control. Elevated JUB1 expression compared with wild-type plants is observed in transgenic lines 1, 3, 5, 6, 7, 9, 11, and 12. (B) Increased JUB1 expression in lines 5 and 9, as confirmed by qRT-PCR, compared with EV control. (C) Delayed bolting in 35S:JUB1 overexpression line compared with the wild type (WT) at 43 d after sowing (DAS). (D) Elevated chlorophyll content in leaves 1 to 12 of 35S:JUB1 overexpressors compared with EV control plants at ~60 DAS (n = 6). (E) Percentage of survived leaves at different plant ages (given as DAS). Bolting time points are indicated by red arrows. Note steeper slope for curve of EV plants compared with 35S:JUB1 overexpressors between days 34 and 56 (n = 14 to 17). (F) Ion leakage of leaves 1 to 12 of 35S:JUB1 and EV control plants at ~60 DAS. Data in (B) and (D) to (F) are the means of at least three biological replicates ± sd.
Figure 2.
Figure 2.
Physiological and Molecular Characterization of the jub1-1 Mutant. (A) T-DNA inserted at nucleotide position 1034 downstream of the start codon (indicated by arrow) in the second intron. (B) Downregulation of JUB1 transcripts in jub1-1 mutant shown by RT-PCR with primers annealing to the start and stop regions of the coding sequence. M, molecular size marker (sizes in base pairs); WT, wild type. (C) Comparison of jub1-1 plants with wild-type plants at 47 DAS. Note early bolting and early senescence in the mutant plants. (D) Downregulation of JUB1 transcript abundance in jub1-1 line, as confirmed by qRT-PCR. (E) The jub1-1 mutant contains less chlorophyll than the wild type in the five biggest leaves at 47 DAS. (F) The jub1-1 mutant exhibits a lower percentage of survived leaves than the wild type at 47 DAS. Data in graphs are the means of at least three biological replicates ± sd.
Figure 3.
Figure 3.
Transcript Profiling of SAGs. (A) Expression of JUB1 and the late-senescence marker gene SAG12 in 35S:JUB1 and jub1-1 plants compared with the wild type (WT) (numbers on the y axis indicate log2 fold-change (FCh) expression ratio compared with the wild type). (B) and (C) Venn diagrams of SAGs differentially expressed in 35S:JUB1 and jub1-1 plants compared with the wild type at 47 DAS. Numbers in parentheses indicate senescence-associated TFs. See also Supplemental Data Set 1 online.
Figure 4.
Figure 4.
Phenotypic Analysis of JUB1-IOE Lines. (A) JUB1 expression is induced in leaves of JUB1-IOE seedlings after treatment with 10 μM EST compared with mock treatment (0.1% ethanol). Treatment times are indicated. Data are the means of three biological replicates ± sd. Fch, fold change. (B) Induction of JUB1 expression by EST in JUB1-IOE plants delays bolting when grown in vitro. Plants were grown for 6 weeks in glass jars on medium containing 10 μM EST (0.1% ethanol for control experiment). In this experiment, five independent transgenic lines were tested; the photographs shown represent a typical result. (C) Delayed senescence in JUB1-IOE plants grown in vitro. Two-week-old JUB1-IOE seedlings were transferred to flasks with liquid medium containing 15 μM EST, or 0.15% ethanol as control, and kept on a rotary shaker (slow motion) under continuous light for 1 week. Note the delayed senescence upon JUB1 induction. Three independent transgenic lines were used to confirm the observation made here.
Figure 5.
Figure 5.
GUS Activity in ProJUB1:GUS Lines. (A) to (I) Arabidopsis. (A) Ten-day-old seedling. GUS staining is mainly localized to cotyledons, the tip regions and margins of leaves representing the oldest but not yet senescent leaf regions, and primary and secondary roots. (B) Ten-day-old seedling. Strong GUS staining located in tips of newly emerging leaves (arrows). (C) and (D) Flowers at different development stages. GUS staining is virtually absent in unopened young flowers. In open flowers (D), GUS staining appears in mature anthers, filaments, and the stamen abscission zone. (E) GUS staining is weak to absent in ~50% expanded leaves from soil-grown plants. (F) Strong GUS staining is located in senescent regions of a partially senescent leaf from soil-grown plants. (G) GUS staining in roots; note the absence of GUS activity in the meristematic zone. (H) GUS staining is absent from emerging lateral roots (arrows). (I) GUS staining in root cap (arrow). Staining was for ~1 h. (J) to (P) Tobacco. (J) Leaf, with more intense staining in the tip and margins. GUS activity is also visible around wound sites. (K) and (L) Young flower without GUS staining. (M) and (N) Open flower showing GUS staining in petal tips and anthers. (O) Roots. Note the absence of GUS activity in the meristematic zone, whereas the root cap shows GUS staining (arrows). (P) Absence of GUS activity from emerging lateral roots (arrows). Staining was for ~6 h.
Figure 6.
Figure 6.
Effect of H2O2 on JUB1 Expression. (A) and (B) JUB1 transcript level in whole seedlings (A) and leaves (B) of wild-type Arabidopsis plants as determined by qRT-PCR after treatment with 10 mM H2O2 for 30 min or 2, 4, and 6 h compared with nontreated samples. (C) ProJUB1:GUS lines treated with H2O2. Two-week-old seedlings were transferred to medium containing 10 or 50 mM H2O2 and incubated for 30 min or 1 h, respectively. Elevated GUS activity was observed at both concentrations already 30 min after treatment. (D) GUS activity of ProJUB1:GUS seedlings measured by a MUG assay after treatment with 10 mM H2O2 for 30 min. Asterisk indicates significant difference (P < 0.05, Student’s t test). Data are the means of three biological replicates ± sd. MU, methylumbelliferone.
Figure 7.
Figure 7.
EST-Treated JUB1-IOE Plants Exhibit Increased Tolerance to NaCl Stress, Whereas Tolerance to NaCl Is Reduced in the jub1-1 Mutant. (A) Two-week-old JUB1-IOE seedlings were transferred from solid MS medium to liquid MS medium containing 150 mM NaCl, in the absence (mock; 0.15% ethanol) or presence of 15 μM EST added to induce JUB1 expression. Plants were incubated for 72 h. EST-treated JUB1-IOE seedlings are more tolerant to salt stress. (B) Higher chlorophyll levels are retained in EST-treated JUB1-IOE seedlings after salt treatment. (C) Seedlings of wild-type (WT) plants are less affected by 72 h salt treatment (150 mM NaCl) than those of the jub1-1 mutant. (D) Chlorophyll content remains higher in the wild type (WT) than jub1-1 plants after stress treatment. Data in (B) and (D) are the means of three biological replicates ± sd.
Figure 8.
Figure 8.
Overexpression of JUB1 Confers Tolerance to H2O2. (A) Two-week-old RD29A:JUB1 and EV seedlings grown on solid MS medium were transferred to liquid medium containing 10 mM H2O2 and incubated for 24 h. RD29A:JUB1 seedlings remained green, whereas EV lines bleached in the presence of H2O2. (B) JUB1-IOE lines treated with 15 μM EST survived better than plants treated with 0.15% ethanol (mock treatment) after transferring 3-week-old plants to fresh medium containing 10 mM H2O2 for 6 d.
Figure 9.
Figure 9.
Overexpression of JUB1 Reduces Endogenous H2O2 Content, While the Opposite Is Observed in the jub1-1 Mutant. (A) DAB staining of wild-type (WT) and jub1-1 seedlings treated with 10 mM H2O2 for 6 h. Note the stronger DAB staining in jub1-1 seedlings in the presence of H2O2. (B) Amplex Red assay. Note the higher H2O2 level in H2O2-treated jub1-1 seedlings compared with the wild type. Asterisks indicate significant difference (P < 0.001). (C) DAB staining. JUB1-IOE seedlings treated with EST for 6 h accumulate less H2O2 than mock-treated seedlings. (D) Amplex Red assay. Note the reduced H2O2 level in EST-treated JUB1-IOE seedlings compared with mock-treated plants (asterisk indicates significant difference; P < 0.02). Data in (B) and (D) are the means of three independent biological replicates ± sd.
Figure 10.
Figure 10.
DREB2A Is a Direct Target of JUB1. (A) Expression of DREB2A in 35S:JUB1, JUB1-IOE, and jub1-1 lines compared with the wild type. Plant ages are indicated in days after sowing (DAS). LD, long day; SD, short day. Numbers on the y axis indicate expression fold change (log2 basis) compared with the wild type. Data represent means ± sd of five (LD) or three (SD) independent experiments. (B) Transactivation of DREB2A expression (from its ~1.8-kb promoter) by JUB1 in Arabidopsis mesophyll cell protoplasts. The ProDREB2A:FLuc construct harboring the DREB2A promoter upstream of the firefly (Photinus pyralis) luciferase (FLuc) open reading frame was cotransformed with the 35S:JUB1 plasmid (omitted in control experiments). The 35S:RLuc vector was used for transformation efficiency normalization. Bars indicate the sd of at least four biological replicates. The asterisk indicates significant difference to control at P < 0.05. (C) EMSA. Purified JUB1-GST protein binds specifically to the JUB1 binding site within the DREB2A promoter. In vitro DNA binding reactions were performed with the 40-bp wild-type fragment of the DREB2A promoter containing the JUB1 motif (5′-GATGCCGTTAGAGACACG-3′). a, GST protein; b, JUB1-GST protein; c, 5′-DY682 double-stranded oligonucleotide containing the perfect JUB1 binding site; d, 100× competitor (unlabeled oligonucleotide containing perfect JUB1 binding site); e, 200× competitor (unlabeled oligonucleotide containing perfect JUB1 binding site); f, 200× mutated oligonucleotide (unlabeled with mutation in JUB1 binding site where 5′-GATGCCGTTAGAGACACG-3′ was replaced by 5′-GATGCCAATAGAGACACG-3′). (D) ChIP-qPCR. Whole shoots of 35-d-old Arabidopsis plants expressing GFP-tagged JUB1 under the control of the CaMV 35S promoter (35S:JUB1-GFP) and wild-type plants were harvested for the ChIP experiment. qPCR was used to quantify enrichment of the DREB2A promoter. As negative controls, primers annealing to promoter regions of two Arabidopsis genes lacking a JUB1 binding site, At3g18040 (Neg 1) and At2g22180 (Neg 2), were used. Data represent means ± sd of three independent experiments.
Figure 11.
Figure 11.
Primary Metabolite Profiling of JUB1 Overexpression Plants. (A) Phenotype of 35-d-old wild-type (WT), RD29A:JUB1, and 35S:JUB1 plants subjected to metabolite profiling. (B) Venn diagram showing an overview of metabolites that are significantly different (P < 0.05, Student’s t test) in 35S:JUB1 and RD29A:JUB1 lines compared with the wild type. (C) Hierarchical average linkage clustering of all detected primary metabolites. For every metabolite, the metabolic content of the wild type was considered as 1 and the metabolic content of overexpression lines was normalized to that. Metabolic ratios: red, minimum (between 0 and −0.4); blue, maximum (between 0 and + 0.4); see also Supplemental Data Set 3 online. Arrows indicate increased trehalose and Pro content in JUB1 overexpressors compared with the wild type.
Figure 12.
Figure 12.
Gene Expression Profiling of Phenylpropanoids, Flavonols, and Anthocyanins, and Metabolite Profiling of Related Secondary Metabolites in 35S:JUB1, jub1-1, and Wild-Type Plants. (A) Expression of 33 enzymatic genes and six TFs as measured by qRT-PCR. Intensity of fold change against wild-type (WT) expression level (log2FC) is indicated by color. Abbreviations are given in Supplemental Table 2 online. (B) to (D) The content of flavonols [quercetin-3-O-(2′′-O-Rha)Glc-7-O-Rha, quercetin-3-O-Glc-7-O-Rha, kaempferol-3-O-Glc-7-O-Rha, and kaempferol-3-O-Rha-7-O-Rha], anthocyanins (A11 and A9; Tohge et al., 2005), and sinapoyl-malate in 35S:JUB1, jub1-1, and wild-type plants was analyzed by LC-MS. Average of two biological replicates ± sd.
Figure 13.
Figure 13.
Hormone Contents in 35S:JUB1, jub1-1, and Wild-Type Plants. Determination of ZR and IPA (A), JA (B), SA (C), and ABA (D) in 43-d-old 35S:JUB1, jub1-1, and wild-type plants grown at long-day conditions (16 h light/8 h dark). Values represent the means ± sd from five independent sets of samples. Asterisks indicate significant differences compared with the wild type (WT) (P < 0.05, Student’s t test). FW, fresh weight.
Figure 14.
Figure 14.
Model of JUB1 Action. JUB1 is activated by H2O2 and during leaf senescence. JUB1 TF binds to the DREB2A promoter, thereby activating its expression. DREB2A positively regulates the expression of HsfA3 (Schramm et al., 2008; Yoshida et al., 2008), thus establishing a transcriptional cascade. As suggested by Nishizawa-Yokoi et al. (2011), HsfA3 together with Hsf1A1e and HsfA2 form an expression amplification loop. HsfA3 and HsfA2 regulate the expression of HSPs and H2O2 scavenging enzymes, leading to reduced intracellular H2O2 levels, extended longevity, and increased stress tolerance. Increased longevity may also be regulated through other JUB1 target genes.

References

    1. Abreu M.E., Munné-Bosch S. (2009). Salicylic acid deficiency in NahG transgenic lines and sid2 mutants increases seed yield in the annual plant Arabidopsis thaliana. J. Exp. Bot. 60: 1261–1271 - PMC - PubMed
    1. Andersson A., et al. (2004). A transcriptional timetable of autumn senescence. Genome Biol. 5: R24. - PMC - PubMed
    1. Arvidsson S., Kwasniewski M., Riaño-Pachón D.M., Mueller-Roeber B. (2008). QuantPrime—A flexible tool for reliable high-throughput primer design for quantitative PCR. BMC Bioinformatics 9: 465. - PMC - PubMed
    1. Balazadeh S., Kwasniewski M., Caldana C., Mehrnia M., Zanor M.I., Xue G.P., Mueller-Roeber B. (2011). ORS1, an H2O2-responsive NAC transcription factor, controls senescence in Arabidopsis thaliana. Mol. Plant 4: 346–360 - PMC - PubMed
    1. Balazadeh S., Parlitz S., Mueller-Roeber B., Meyer R.C. (2008a). Natural developmental variations in leaf and plant senescence in Arabidopsis thaliana. Plant Biol. (Stuttg.) 10(suppl. 1): 136–147 - PubMed

Publication types

MeSH terms